Follow us


This report updates the Children’s Commissioner’s Stability Index with the latest available data, covering children in care looked after by English local authorities as at 31st March 2018. As with the two previous iterations of the Index, this analysis focuses on the following three types of stability experienced by Looked After Children (LAC):
Last year’s report demonstrated that for the cohort of children in care at 31st March 2017:
Around 1 in 4 children had experienced multiple changes in social worker over the past 12 months. This was based on a sample of 78 local authorities.
There is wide variation by local authority in rates of instability across measures
Key factors associated with higher rates greater placement and school instability often relate to the complexity of child’s needs, while factors associated with higher rates of social worker stability relate to features of local social work workforce. But in all cases these factors can only explain a small part of the variation that we see.
The analysis in this report updates these findings for the cohort of children in care at the 31st March 2018. We examine the following questions:
Furthermore, we focus on LAC with complex needs due to the high levels of instability these children face and the key role they have in determining overall levels of instability within a local authority.
As with previous years, measures of placement stability are derived from the Children Looked After Census and relate to the cohort of children in care at 31st March. Table 1 demonstrates the profile of this sample.
Table 1: Profile of children in care at 31st March 2018. N = 75420
Child characteristic | Category | Count | % |
Age at 31st March 2018 | 0-4 | 14,080 | 19 |
12-15 | 21,430 | 28 | |
16+ | 17,410 | 23 | |
5-11 | 22,500 | 30 | |
Age at earliest period of care | 0-4 | 28,740 | 38 |
12-15 | 13,470 | 18 | |
16+ | 3,880 | 5 | |
5-11 | 29,330 | 39 | |
Gender | Female | 33,100 | 44 |
Male | 42,320 | 56 | |
In care in both 2017/18 + 2016/17 | No | 22,830 | 30 |
Yes | 52,590 | 70 | |
In care throughout 2017/18 | No | 23,060 | 31 |
Yes | 52,360 | 69 | |
Type of 1st legal status in 2018 | Criminal Justice legal status | 320 | <1% |
Emergency protection order | 490 | 1 | |
Full care order | 36,070 | 48 | |
Interim care order | 15,000 | 20 | |
Other | <5 | <1% | |
Placement order | 2,410 | 3 | |
Police protection | 1,950 | 3 | |
S20 | 19,170 | 25 | |
Type of first placement in 2018 | Fostered not with relatives | 49,380 | 65 |
Fostered with relatives | 9,680 | 13 | |
Hospital | 970 | 1 | |
Independent Living | 1,770 | 2 | |
Other | 360 | <1% | |
Other institution | 1,030 | 1 | |
Placed for adoption | 290 | <1% | |
Placed with parents | 4,250 | 6 | |
Residential | 7,690 | 10 |
For our purposes a change in placement is a change in a child’s carer during their time in care. This includes any re-entries into care during the relevant time period, however for children not in care at the start of the time period, we exclude their first entry into care. Clearly some of these changes of carer may be for good reasons however it is not possible within the CLA census to define or identify changes that are ‘good’ or ‘bad’. For consistency with national statistics published by the Department for Education (DfE), we have also excluded any episodes of respite care from our counts.
Similar caveats with this sample apply as with last year’s, namely that:
Not all children in our sample are in care for the whole of 2017/18. In total, 23,060 children (31% of the sample) were not in care throughout 2017/18. They therefore had less time in care during which they could experience placement moves, compared to those in care continuously for at least 12 months.
Similarly when looking at instability over the longer term, not all children will have been in care continuously over the required time period. For these individuals, therefore, measures of longer term placement instability cannot be defined. The samples are therefore restricted to children in care for at least one day during the first and last year of the relevant time period. For example measures looking at a child’s instability over a two-year period are restricted to the 52,590 children in care for at least one day in both 2016/17 and 2017/18.
There are some slight revisions to the previous year’s figures for 2016/17, as a result of revisions to the underlying CLA Census extract produced by DfE. This is common with administrative data and simply reflects updated records in local authorities. This also affects published national statistics: for example the published number of children in care in at the 31st March 2016/17 in the original statistical first release was 72,670; this was revised down slightly to 72,590 in the most recent statistical release. To ensure consistency with published totals, levels of placement instability in 2016/17 have been recalculated based on this revised underlying data. This means results for 2016/17 (and other previous years) presented below may not match those in the 2018 Stability Index publication exactly, though differences are minor.
As with previous years, details on children’s school histories are sourced via matching the CLA Census to the Pupil Level School Census. This provides information on school entry dates as well as other characteristics contained in these school records - for example any SEN provision or any contact time with a pupil referral unit (PRU). School moves are defined based on these school entry dates. A mid-year school move is defined as a change of school where the start date at the new school occurs after the first 3 weeks of September in the relevant academic year.
Based on feedback on last year’s report, we have made some improvements to the methodology for counting school moves. These amendments mean that figures in this report for previous years will not match those reported in previous Stability Index publications (though differences are for the most part minor), as previous years’ figures have been recalculated to incorporate these amendments. The amendments are:
We have removed the need for a child to be enrolled at school in both the Autumn and Summer term censuses of a particular academic year. This restriction had been included in previous years to avoid counting school moves due to immigration, but it meant that children out of school at either the Autumn or Summer census dates were excluded the sample, resulting in in a low match rate to the CLA Census. It also excluded a number of children with more unstable school histories, likely resulting in an underestimate of the levels of school instability experienced. We have now replaced this condition with the condition that a child must be in any of the termly school censuses during the relevant time period. This is has resulted in a higher match rate between with the CLA Census.
We have better accounted for schools that have academised. In some cases, academisation can result in school entry dates being (incorrectly) recorded as the date of the school’s academisation. To counter this, we have mapped schools’ LAESTAB codes to the DfE’s InstitutionID codes (a unique identifier used to link predecessor and successor schools). A child’s school entry date is then defined as the earliest entry date associated with an InstitutionID.
As with last year, when looking at any school moves (including entry dates in the first three weeks of September), we have excluded moves from primary to secondary school. However, this year we have also been able to better account for moves that were from primary to middle school or middle school to secondary. These moves are now excluded from our measure start of year school moves.
Previously there has been a slight mismatch between time periods across the three domains, with school moves being defined at any point during the academic year whereas placement and social worker changes are based on financial years. These have been aligned in this year’s report: all school changes are now counted over the year to March.
This year we have matched the CLA Census to the School Census via both a child’s Unique Pupil Number (UPN) and any former UPNs. This allows us to better account for differences in recording of UPNs between the two datasets. Any duplicates have been excluded based on the DfE’s derived pupil matching reference (PMR), and records have been excluded where multiple dates of birth or gender are associated with a UPN or former UPN.
It should also be noted that matching to the School Census by definition excludes looked after children who have not yet entered or who have left school, as well as many of those in further education institutions not covered by the School Census and those in the independent sector. The analysis will also miss children not currently enrolled in school or those not assigned a UPN at any point.
The overall match rate with the School Census for all children in care at the 31st March 2018 was 74% (a considerable improvement over the 56% match rate achieved in last year’s Stability Index). This results in a matched sample size of 54,690. Table 2 below demonstrates the characteristics of this matched sample compared to all LAC aged 5+.
Table 2: Profile of matched CLA and School Census sample
Child characteristic | Category | All CLA aged 5+ percentage (n) | Matched sample aged 5+ percentage (n) |
Age at 31st March 2018 | 12-15 | 35 (21,430) | 37 (19,990) |
16+ | 28 (17,410) | 24 (13,090) | |
5-11 | 37 (22,500) | 40 (21,600) | |
Age at earliest period of care | 0-4 | 24 (14,650) | 25 (13,700) |
12-15 | 22 (13,470) | 21 (11,540) | |
16+ | 6 (3,880) | 3 (1,610) | |
5-11 | 48 (29,330) | 51 (27,840) | |
Gender | Female | 43 (26,430) | 46 (24,960) |
Male | 57 (34,900) | 54 (29,730) | |
In care in both 2017/18 + 2016/17 | No | 23 (14,210) | 21 (11,410) |
Yes | 77 (47,130) | 79 (43,280) | |
In care throughout 2017/18 | No | 23 (14,390) | 21 (11,580) |
Yes | 77 (46,940) | 79 (43,110) | |
Type of 1st legal status in 2018 | Criminal Justice legal status | 1 (320) | <1% (270) |
Emergency protection order | <1% (250) | <1% (240) | |
Full care order | 56 (34,410) | 59 (32,500) | |
Interim care order | 12 (7,580) | 13 (7,320) | |
Other | <1% (<5) | <1% (<5) | |
Placement order | 2 (1,460) | 2 (1,360) | |
Police protection | 2 (1,170) | 2 (1,080) | |
S20 | 26 (16,130) | 22 (11,930) | |
Type of first placement in 2018 | Fostered not with relatives | 66 (40,470) | 68 (37,250) |
Fostered with relatives | 12 (7,210) | 13 (6,930) | |
Hospital | <1% (140) | <1% (110) | |
Independent Living | 3 (1,770) | 1 (760) | |
Other | <1% (240) | <1% (220) | |
Other institution | 1 (730) | 1 (620) | |
Placed for adoption | <1% (190) | <1% (180) | |
Placed with parents | 5 (2,900) | 5 (2,770) | |
Residential | 13 (7,680) | 11 (5,860) |
Note: Given the limitations of the School Census dataset it is useful to look at match rates for those aged 5-15. This gives a better indication of non-matching due to data quality rather than coverage of the School Census. The match rate for 5-15 year olds is 95% suggesting the vast majority of those in care that are likely to be covered by the School Census have some form of school history during the 2017/18. This compares to a corresponding match rate of 85% achieved in last year’s analysis.
Part of this analysis looks in detail at instability for looked after children with complex needs. There is no marker indicating whether a child has ‘complex needs’ within the LAC census and as a result we rely on proxy indicators to define this group. For our purposes we look at children with the following indicators of complex need:
As well as looking at these characteristics individually, we have also created summary scores of complexity of behavioural and health related needs, taking into account the fact that children can have combinations of the above factors. These scores are a weighted sum of the indicators above with higher scores indicating greater complexity. The detailed method for creating these scores is outlined in Appendix B. We also examine rates of instability amongst the group of looked after children with the most complex needs. This highest complexity group is defined using a data-led approach that clusters children into their most similar groups based on their summary health and behavioural need scores (see Appendix B for details). This highest complexity group broadly corresponds to children with above average complex health needs and those with behavioural need scores in the top third of the cohort.
Overall, rates of multiple placement changes amongst LAC in 2017/18 are similar to those in 2016/17 (Table 4). 10.4% (7,880) of children experienced 2 or more placement changes in 2017/18 compared to 10.6% (7,680) in 2016/17. This shows that there remains a minority of around 1 in 10 children that are experiencing multiple placement moves within a year.
Table 4: Cumulative distribution of number of placement changes during the year
Number of placement changes | 2017 | 2018 |
0 | 67.5% (49,030) | 68.4% (51,570) |
1+ | 32.5% (23,560) | 31.6% (23,850) |
2+ | 10.6% (7,680) | 10.4% (7,880) |
3+ | 4.1% (2,980) | 4.1% (3,070) |
4+ | 1.9% (1,340) | 1.8% (1,360) |
5+ | <1% (640) | <1% (670) |
6+ | <1% (330) | <1% (350) |
7+ | <1% (180) | <1% (180) |
Measures of planned placement changes are limited in the CLA census, particularly with regards to the degree to which the child has been involved in the decision. However, some limited indications are available from the recorded reason for a placement change. This suggests that, of placement changes where a child experiences a change in carer, 39.3% were due to a change in (or in line with) a child’s care plan. The next most common reason is that the placements ended due to the carer’s request (23.3%). In only 4.9% of placement changes did the child request the end of the placement (Note: this is likely an under count as only the main reason for a placement change is recorded, meaning that placements ending by mutual consent are impossible to identify). As a note of caution, it should be borne in mind that in 1 in 4 cases, the reason for the placement change was recorded as ‘Other’. These rates are very similar to the previous year (Table 5).
Table 5: Reasons for placement changes recorded in 2016/17 and 2017/18 CLA Census. Note: base is number of placement changes experienced by the cohort during the year. %s exclude placement changes where no information is recorded
Reason for placement change | 2017 | 2018 |
Allegation related to S47 enquiry | 1.4% (450) | 1.4% (480) |
Approval removed | 0.3% (110) | 0.5% (150) |
Carer requests placement end due to child's behaviour | 16% (5,320) | 16.2% (5,520) |
Carer requests placement end other than due to child's behaviour | 6.9% (2,290) | 7.1% (2,410) |
Change to/Implementation of Care Plan | 36.6% (12,210) | 39.3% (13,340) |
Child requests placement end | 5.1% (1,710) | 4.9% (1,670) |
Other | 27.3% (9,100) | 25.2% (8,560) |
Resignation/closure of provision | 1% (320) | 0.9% (300) |
Responsible/Area authority requests placement end | 3.9% (1,300) | 2.8% (960) |
Standards of Care concern | 1.6% (520) | 1.7% (570) |
Children whose first placement during the year was an entry into care accounted for 45% of the placement moves during 2017/18. While this is slightly higher than their share of the population in care at the 31st March (40%), this suggests that the majority of placement changes are for children already in care at the start of the year.
Around 1 in 3 of all placement changes during the year (35%) occurred after the placement had lasted for 6 months or longer. This is similar to the level in 2016/17 (36%).
Looking over 2 years suggests that longer term instability is also broadly unchanged between 2016/17 and 2017/18. 2.7% of children in care at the 31st March 2018 in care in both 2016/17 and 2017/18 (1,420 children) had experienced 2+ placement changes in both these years. This compares to 2.6% of those in care at the 31st March 2017. This suggests that (for those in care for both years) 28% of those experiencing 2+ placement moves in 2017/18 had also experienced 2+ placement changes the previous year.
Looking over longer time periods, it remains the case that most looked after children will have experienced a change in placement over the last 3 years (Table 6). These rates are also largely unchanged compared to the cohort of children in care at the 31st March 2016/17.
Table 6: Placement stability over 2-4 years
Placement Changes | Changes over 1 year | Changes over 2 years | Changes over 3 years | Changes over 4 years | ||||
2017 | 2018 | 2017 | 2018 | 2017 | 2018 | 2017 | 2018 | |
0 | 67.5% (49,030) | 68.4% (51,570) | 53% (27,000) | 53.5% (28,540) | 45.7% (17,590) | 48.1% (19,130) | 40.3% (12,140) | 42.3% (13,230) |
1+ | 32.5% (23,560) | 31.6% (23,850) | 47% (23,980) | 46.5% (24,840) | 54.3% (20,880) | 51.9% (20,600) | 59.7% (17,990) | 57.7% (18,040) |
2+ | 10.6% (7,680) | 10.4% (7,880) | 22.7% (11,580) | 22.8% (12,160) | 30.4% (11,710) | 29.7% (11,780) | 35.7% (10,770) | 35% (10,930) |
3+ | 4.1% (2,980) | 4.1% (3,070) | 11.4% (5,820) | 11.4% (6,080) | 17.4% (6,700) | 17.2% (6,840) | 21.6% (6,520) | 21.6% (6,760) |
4+ | 1.9% (1,340) | 1.8% (1,360) | 6.1% (3,140) | 6.3% (3,360) | 10.3% (3,970) | 10.4% (4,120) | 13.7% (4,120) | 13.7% (4,290) |
5+ | <1% (640) | <1% (670) | 3.5% (1,780) | 3.6% (1,940) | 6.3% (2,420) | 6.4% (2,560) | 8.8% (2,660) | 8.9% (2,780) |
6+ | <1% (330) | <1% (350) | 2.1% (1,050) | 2.2% (1,180) | 4% (1,540) | 4.2% (1,680) | 5.8% (1,750) | 6% (1,870) |
7+ | <1% (180) | <1% (180) | 1.2% (640) | 1.3% (710) | 2.6% (1,000) | 2.9% (1,140) | 4% (1,200) | 4.1% (1,290) |
There remains wide variation between LAs in rates of placement instability. In 2017/18, the rate of children experiencing 2+ placement moves in the previous 12 months (among those looked after on 31 March 2018) varied from 4% to 20% across LAs. (Note: this excludes two outliers that are due to small bases and known differences in recording placement changes).
Figure 1: Map of rates of multiple placement moves in 2017/18. Note: map excludes outliers of City of London and Torbay due to small bases and known differences in recording
70 LAs (out of 151 - 46%) have seen increases in their rates of placement instability over the last 12 months. Within this, 6 have seen these rates increase by more than 5 percentage points (Figure 2).
Figure 2: Rates of LAC with 2+ placement moves by local authority in 2016/17 and 2017/18. Note: diagonal line is 45-degree line where rates in 2016/17 and 2017/18 are equal. Each data point represents an LA; size of the data point is proportional to number of LAC in that LA.
While Figure 2 demonstrates that there is some correlation between years in rates of multiple placement moves (r = 0.66), this correlation is not perfect. For context, rates of 2+ placement moves explain 43% of the variation in rates in 2017/18 (slightly higher than 35% last year), suggesting the majority of variation is due to factors other than the previous year’s rate.
There are 15 LAs whose rate is in the top 20% in both years, and 7 LAs whose rate is in the top 10% in both years. Looking over 3 years there is even more variation over time - 7 LAs are in the 20% of LAs with the highest rates of children with 2+ placement moves for 3 years running (while only 3 are in the top 10% for 3 years running).
Given this variation in rates by local authority, it is useful to examine which factors help explain this variation. The correlations below focus on the average rate across 2016/17 and 2017/18 as this helps to account for fluctuations between years in an LA and helps to highlight those that have persistently higher levels.
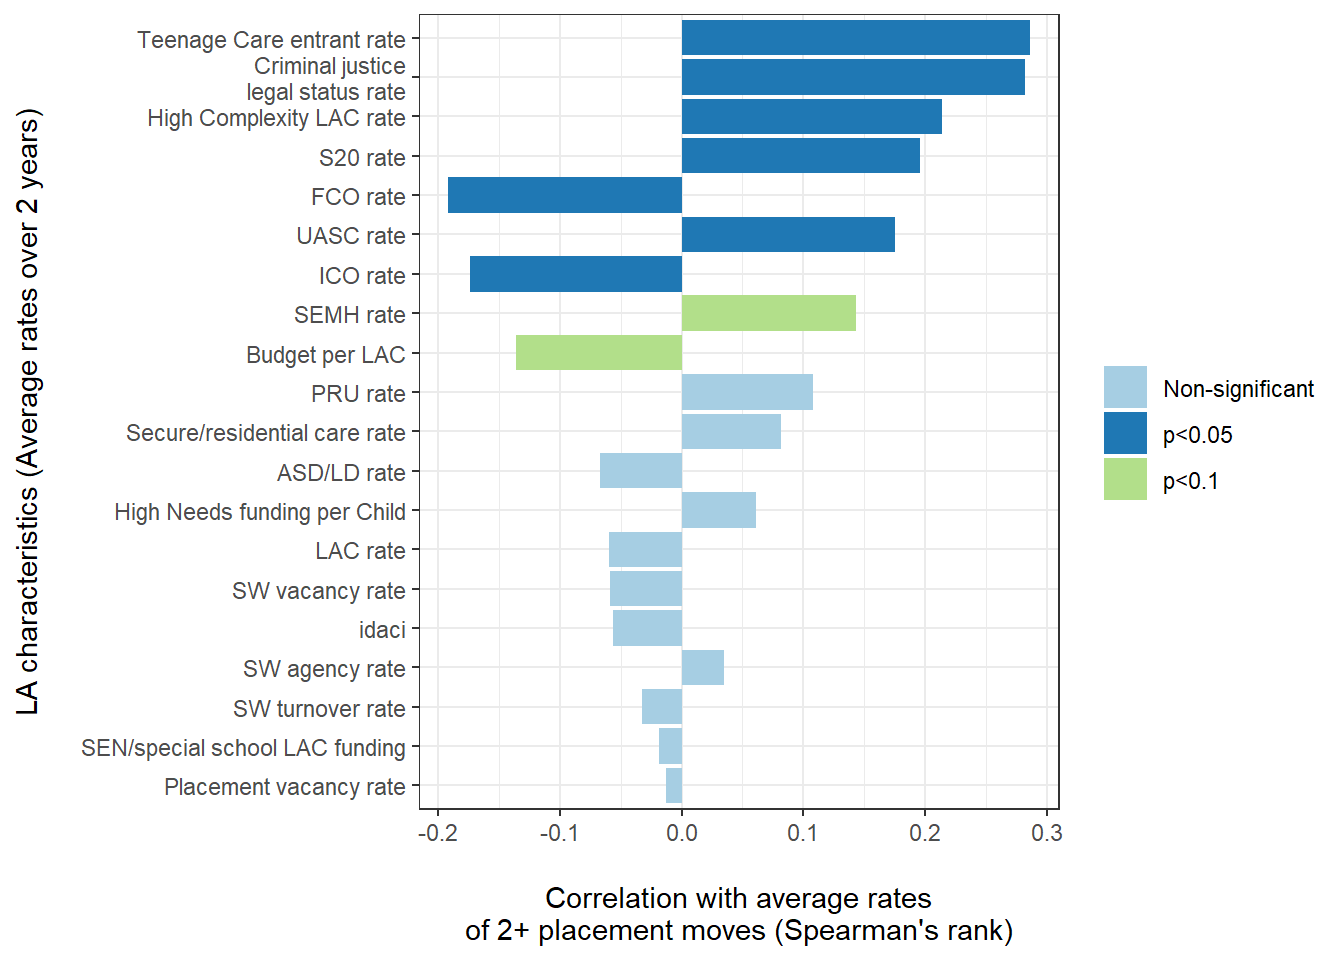
Figure 3 demonstrates that it is primarily factors relating to the complexity and legal status case mix in an LA which have the strongest correlations with average levels of placement instability over the 2 years.
For example a rate of teenage care entrants 10 percentage points higher than average is associated with a 3 percentage point higher (on average) rate of multiple placement moves. Similarly, a 10 percentage point higher rate of children looked after under section 20 is associated with 0.7 percentage point higher (on average) rate of multiple placement moves.
While the analysis does indicate that there are factors with a statistically significant correlation with placement stability rates, together they explain only 15% of the variation between LAs in rates of placement instability. This suggests there are other unmeasured factors that drive the majority of this variation.
Figure 3: Correlations at LA level between various factors and rates of multiple placement changes in 2017/18
As with last year, there appears to be no correlation between an LA’s Ofsted rating3 for Looked After Children and its rate of multiple placement moves. LAs rated ‘Inadequate’ have the same average rates of children with 2+ placement moves in 2017/18 to those rated ‘Outstanding’ (Table 7).
Table 7: Average rates of multiple placement moves by LA LAC Ofsted rating
LA LAC Ofsted rating | % with 2+ placement moves 2017/18 |
Outstanding | 10.8% (480) |
Good | 10.6% (5,590) |
Requires | 10.4% (8,250) |
Inadequate | 10.8% (1,230) |
There is also notable variation amongst LAs within these Ofsted rating categories (Figure 4). For example, average rates of multiple placement moves over 2016/17 and 2017/18 range from 4% to 23% in local authorities rated Good.
Figure 4: Distribution of rates of multiple placement changes by LAC Ofsted Rating
We have also examined changes over time in LA rates of placement instability, and the factors which could be associated with that. Figure 5 demonstrates that few factors have obvious correlations that may explain changes over time within LAs. There are small correlations between falling rates of children with 2+ placement moves and increased ratios of available foster placements in an area4, though this explains only 2% of the variation in changes between LAs.
Figure 5: Correlations at LA level between various factors and annual change in rates of multiple placement changes between 2016/17 and 2017/18
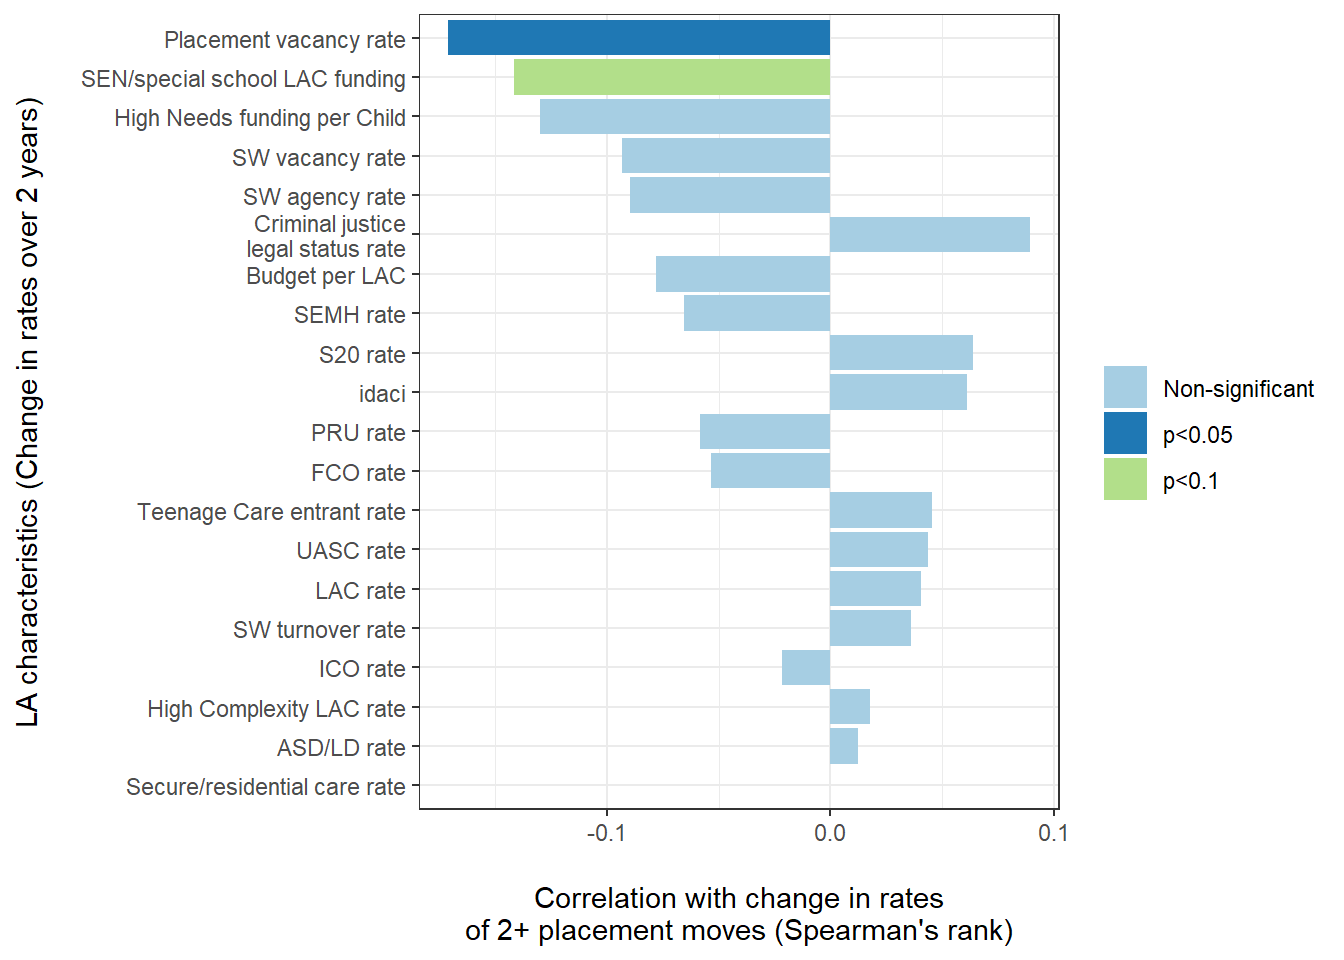
Figure 6 demonstrates that many groups of looked after children with complex needs have notably higher than average rates of multiple placement moves within a year, with some groups having over twice the average rate for all looked after children (illustrated by the vertical black dashed line). These rates are also largely unchanged compared to the previous year.
Figure 6: Rates of multiple placement moves among subgroups of LAC with complex needs
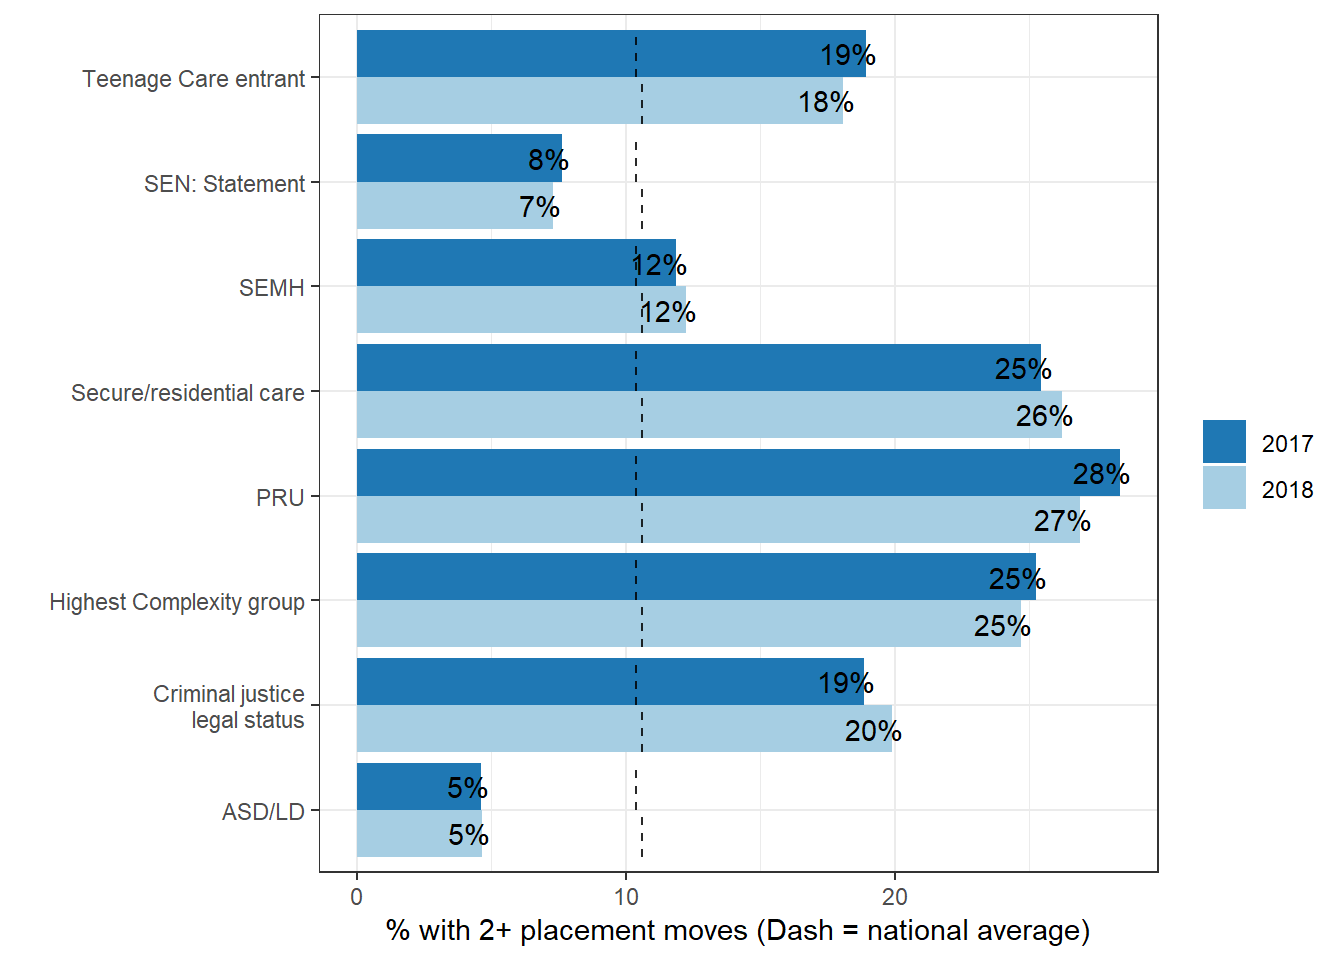
Figure 7 below demonstrates that the rates for these subgroups vary notably by LA. For example, rates of multiple placement moves in 2017/18 amongst teenage care entrants vary from 4% to 42%, while the rates among amongst children in secure or residential care varied from 8% to 71%. Even amongst a group that experiences slightly more stability on average - LAC with statements or EHC plans - rates of placement instability in 2017/18 range from 1% to 28% across LAs.
Figure 7: Rates of multiple placement moves for subgroups of LAC with complex needs by Local Authority. Note: point size is proportionate to LA base size and plot excludes LAs with less than 5 LAC in a category
To examine placement stability amongst LAC with the most complex needs in more detail, we compare the placement journeys of the 2017/18 highest complexity LAC group to their peers focusing on those that entered care in the first 6 months of 2016/17 and were still in care at 31st March 2017/18 (full cohort size = 7,078, number in highest complexity group = 492).
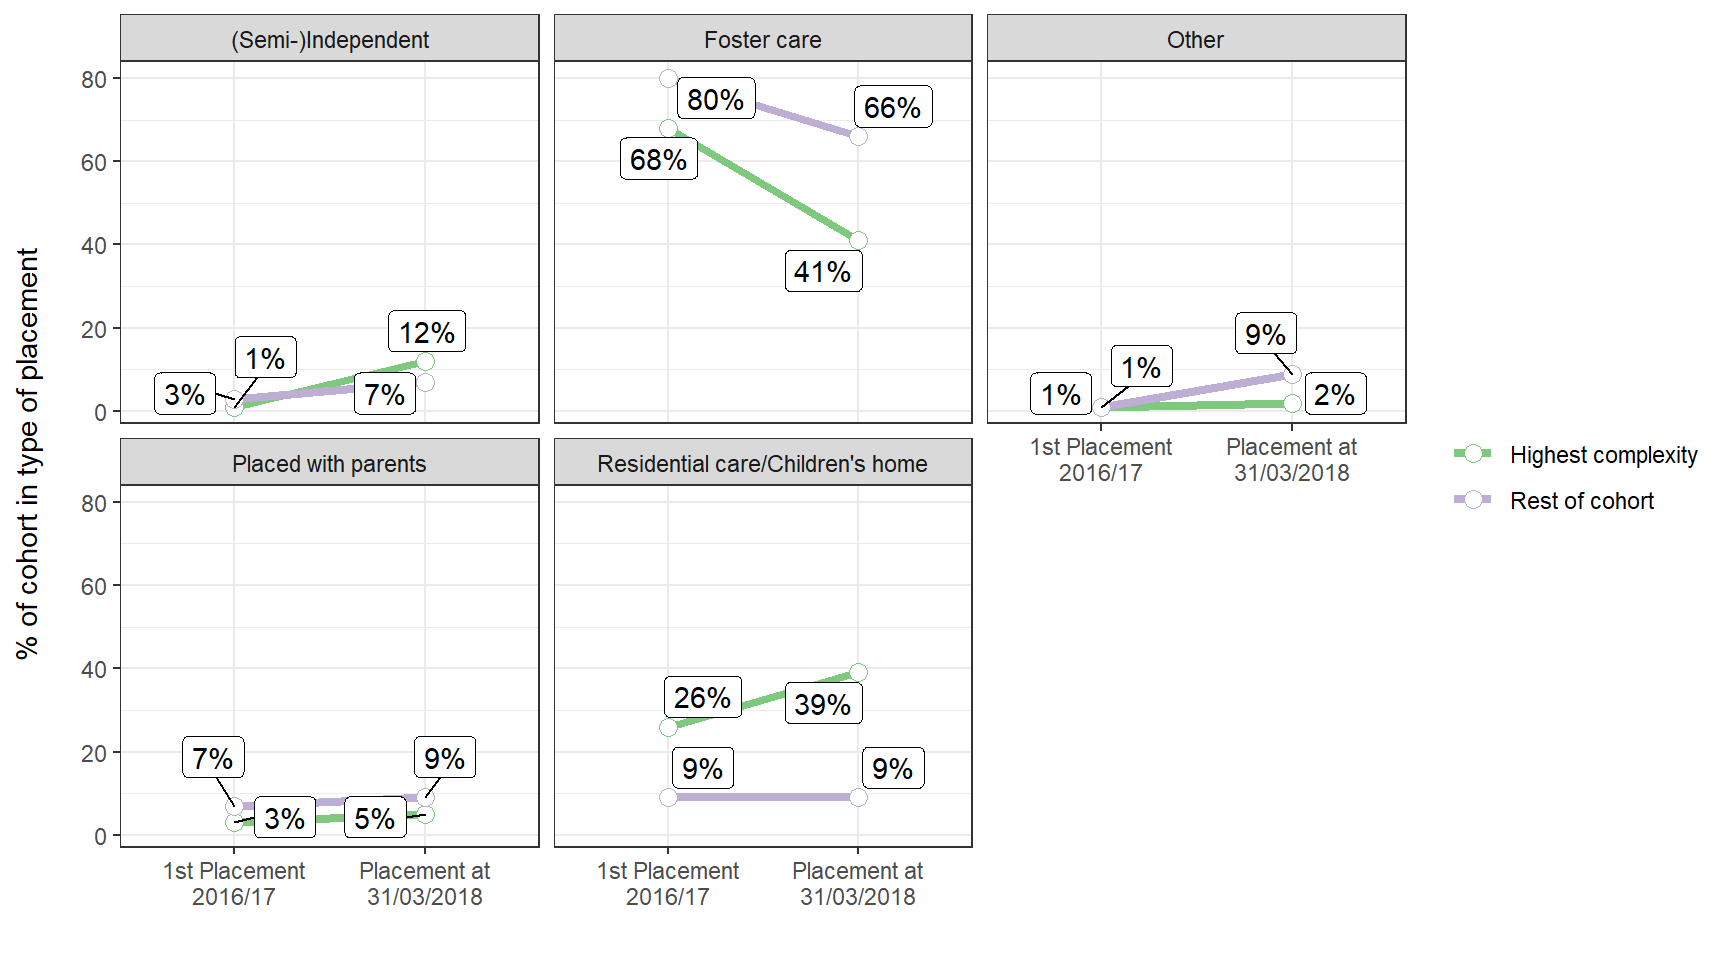
Upon entry into care, the differences in placement type between the highest complexity LAC group and the rest of the cohort were small or moderate. Figure 8 demonstrates that percentages are similar in foster care at the children’s first placement but that this drops notably more amongst the high complexity group. After that point, the proportion in residential care and those in (semi-)independent accommodation rises notably for the highest complexity LAC group, but not for the rest of the cohort.
These high complexity LAC had a similar profile of initial placements to the rest of the cohort but are more likely to move into residential care and (semi-)independent accommodation later on. Figure 8 demonstrates that percentages are similar in foster care at the children’s first placement but that this drops notably more amongst the high complexity group. The proportion in residential care and those in (semi-)independent accommodation also rises notably over the same time period.
Figure 8: Placement types at first and last placement among highest complexity LAC subgroup and rest of the cohort
There is also evidence that these LAC with complex needs are more likely than other LAC to move from LA provision into privately run institutions over time. Figure 9 demonstrates this high complexity LAC group is as likely to be in LA provision at their first placement but eventually half are in private provision compared to only a quarter of the rest of the cohort.
Figure 9: Provider types at first and last placement among highest complexity LAC subgroup and rest of the cohort
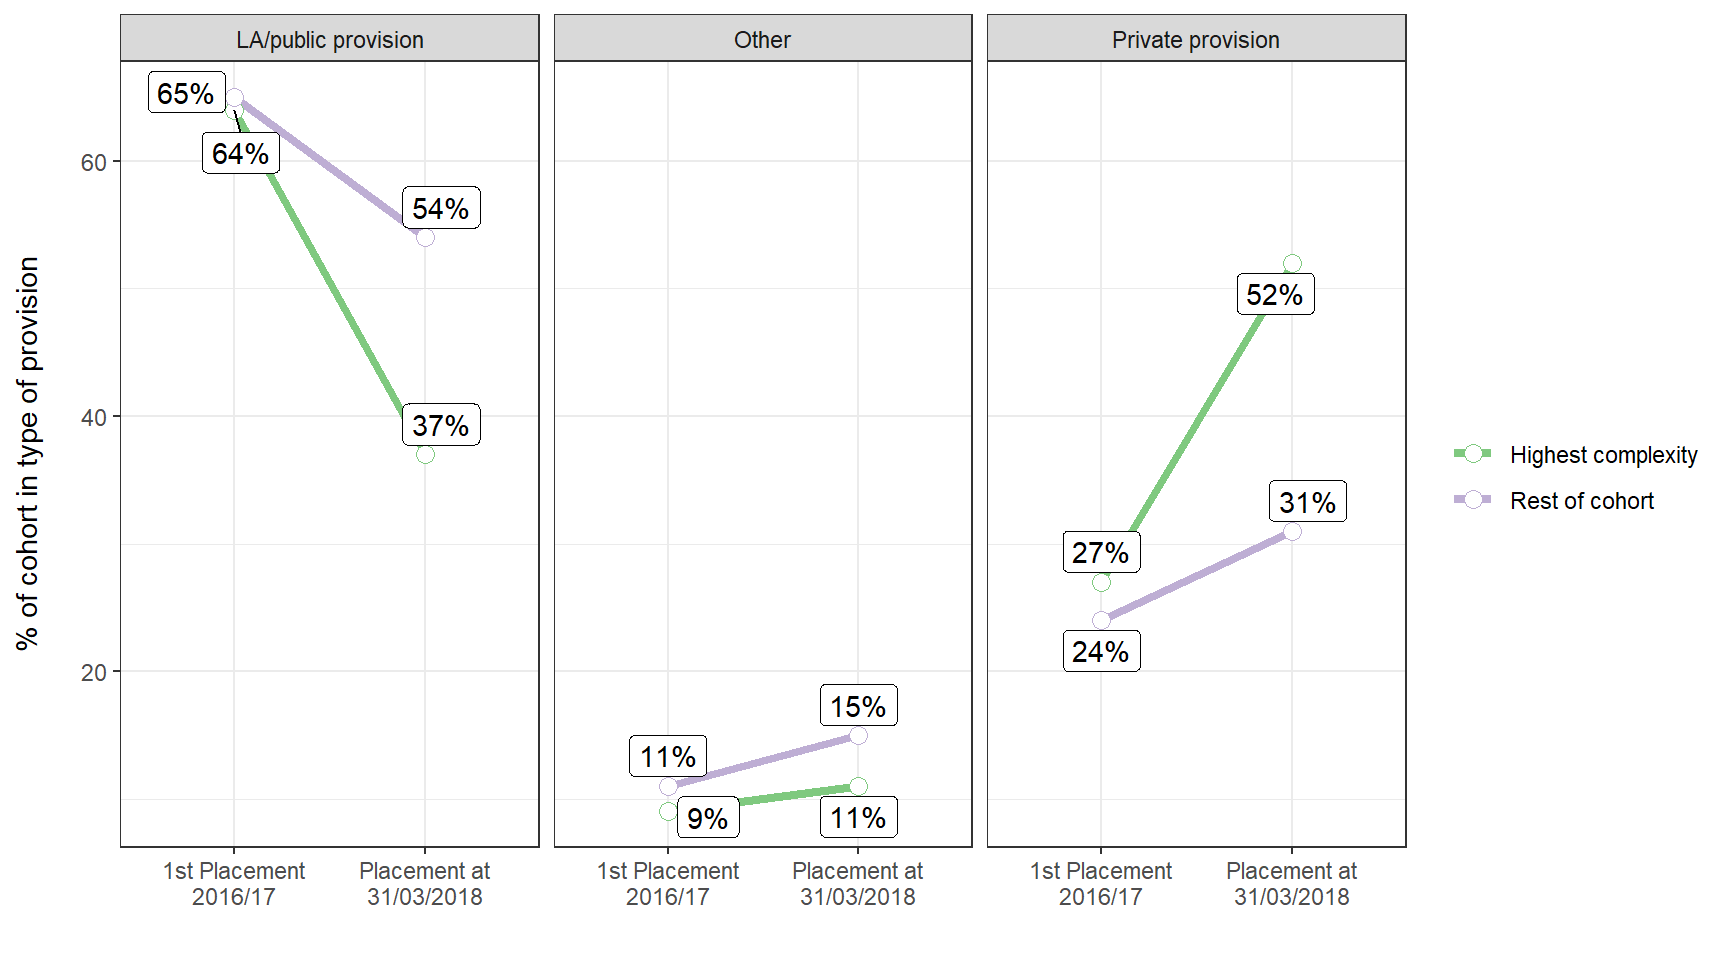
The highest complexity LAC group also experiences more placement instability in the intervening period compared to the rest of the cohort. On average they have approximately twice the number of placement moves - 2.8 compared to 1.5 for the rest of the cohort - between their entry into care and the 31st March 2018.
Taken together, this suggests that there is a cohort of LAC with particularly complex needs that are entering into similar placements as their peers but moving placement more frequently and gradually ending up in private residential care during the 2 years. This is notable because these private residential placements are expensive to provide. CCO research (based on data from 9 LAs - see Stanford and Lennon 2019) provides indicative figures for the cost to these LAs of circa £260,000 per child over 2017/18 for high cost residential provision. While there are differences in definitions this provides indications of the resource cost of this provision used by LAC with the most complex needs.
Overall, there has been a small reduction in rates of mid-year school moves amongst LAC in 2017/18 compared to the previous year. In 2017/18, 11% of LAC aged 5+ enrolled in school (6,230 children) had a mid-year school move, compared to 13% (6,640 children).
Among the LAC who had a mid-year school move in 2017/18, 19% had that move within 1 month of a placement move. This is the same percentage as in 2016/17.
There also remains a small number of LAC who are out of school for more than a term as a result of a mid-year move. 330 LAC - 5% of those who experienced a mid-year move in 2017/18 - were also out of school for at least 1 term during the year. This is similar to the level in 2016/17 (320 - 5%).
There has been little change in the distances that looked after children are moving at a mid-year school move. On average they moved 26 miles between schools at a mid-year school move, compared to 27 miles in 2016/17.
There has also been little change in the proportion of LAC experiencing any form of school move in 2 consecutive years. Around 4% (2,000) of LAC aged 5+ had a school move of any sort in both of the 2 previous years, compared to 3% (1,710) of those in care (and aged 5+) at the 31st March 2017.
Overall, of LAC aged 5+, 33% had any school move in the last 2 years, 44% had any school move in the last 3 years.
As with last year there remains considerable variation by local authority in rates of mid-year school moves. Rates range from 4% to 22%.
Figure 10: Map of rates of mid-year school moves in 2017/18. Note: map excludes City of London due to small bases
These rates also vary from one year to the next, even for the same LA. Figure 11 demonstrates that there is only a small correlation between one year and another in an LA’s rate of mid-year school moves (r = 0.29). Indeed the rate in 2016/17 only explains 8% of the variation of the rate in 2017/18. 46 LAs (out of 150 - 31%) have seen increases in their rates of mid-year school moves over the last 12 months. 7 have seen these rates increase by more than 5 percentage points. Only 13 LAs are in the top 20% of LAs for the last 2 years (compared to a theoretical maximum of 30 LAs). Note: these figures exclude City of London who only had 2 LAC children in school during 2017/18
Figure 11: Rates of mid-year school moves amongst LAC in 2016/17 and 2017/18. Note: diagonal line is 45-degree line where rates in 2016/17 and 2017/18 are equal. Each data point represents an LA; size of the data point is proportional to number of LAC in that LA.
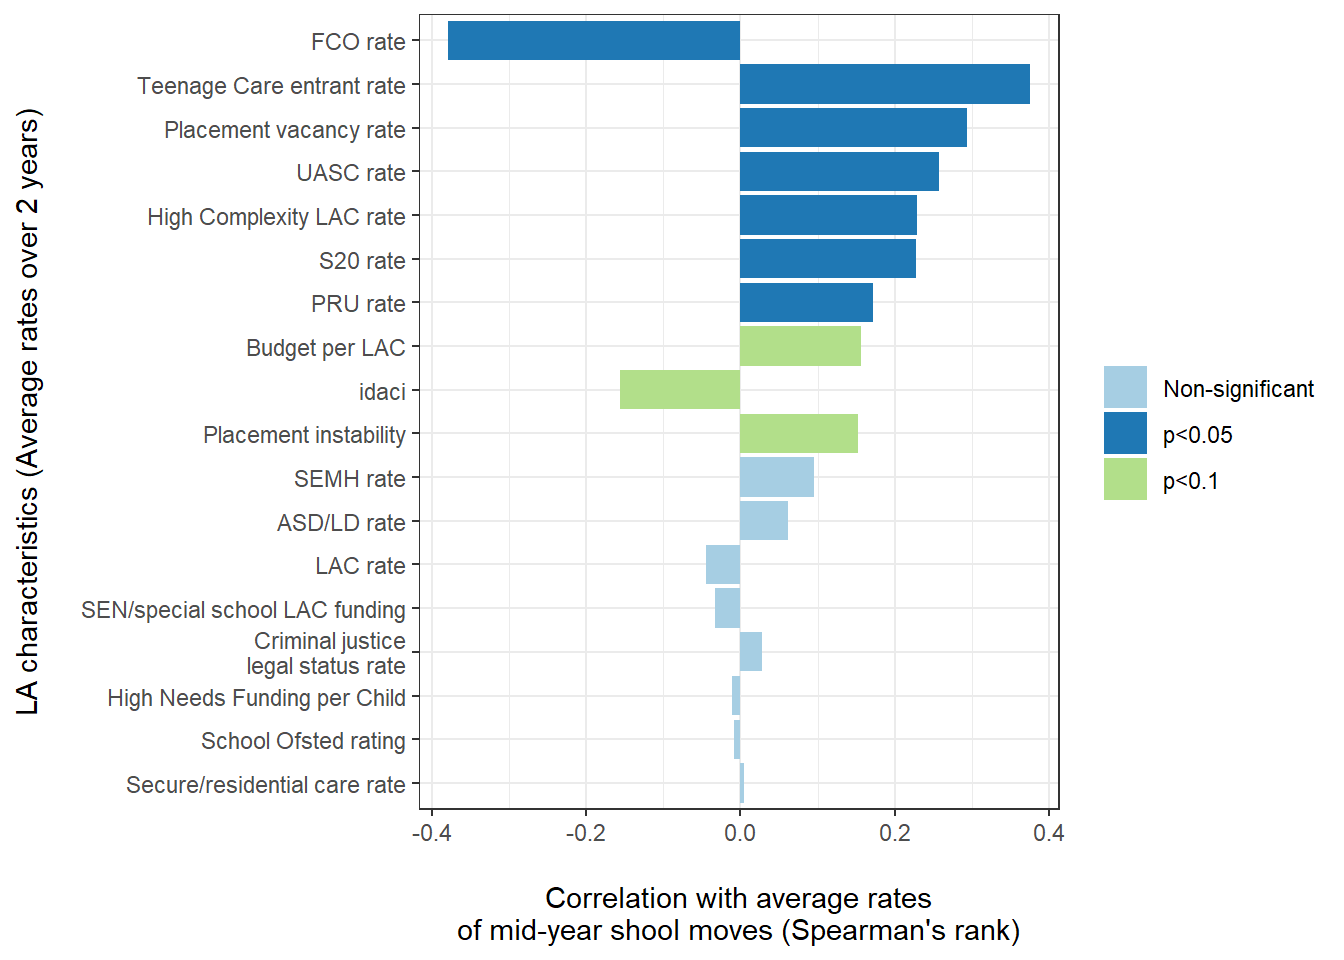
As with placement stability, there are strong links between an LA’s 2 year average rate of mid-year school moves and the complexity and legal status mix of its looked after children population (Figure 12).
For example an LA with a 10 percentage point higher rate of teenage care entrants in their LAC population is associated with on average 4 percentage point higher rates of LAC with a mid-year school move during the year.
There is also a small link between rates of school instability and placement supply factors. An LA with a 10 percentage point higher vacancy rate of foster placements is associated with on average 0.8 percentage point higher rates of looked after children with a mid-year school move during the year. While this correlation is statistically significant, it is very small and unexpected in direction (particularly given the link between higher rates of placement instability and higher rates of school instability in an LA). We therefore suggest caution in interpreting it.
Together these case mix and placement factors only explain 26% of the variation between LAs, suggesting there are many other factors contributing to the variation across LAs.
Figure 12: Correlations at LA level between various factors and rates of mid-year school moves among LAC in 2017/18
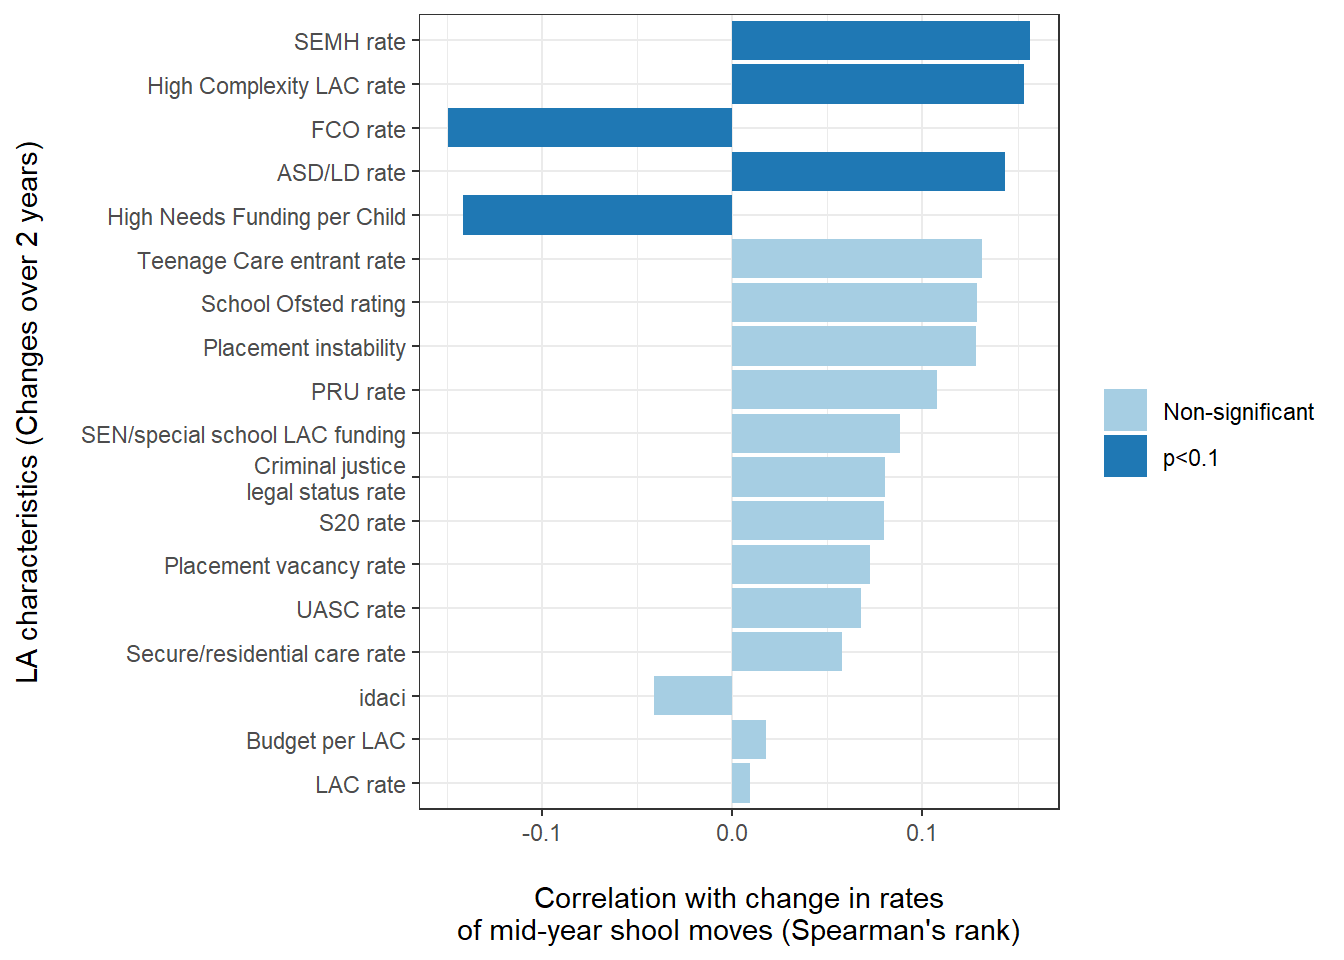
The change in the complexity of the needs of an LA’s LAC cohort is also most predictive of changes in rates of mid-year school moves in an LA (Figure 13) though these correlations are only borderline significant (p value < 0.1 but greater than 0.05). For example there is a small correlation between increases in rates of children with SEMH as their primary SEN type in a local authority and increasing rates of mid-year school moves. However, these correlations only explain 5% of the variation between LAs, suggesting very little explanatory power.
Figure 13: Correlations at LA level between various factors and annual change in rates of mid-year school moves among LAC between 2016/17 and 2017/18
Note: school inspection data is sourced from Ofsted management statistics and refers to the first school a looked after child attended during 2017/18. Inspection judgements relate to the closest inspection date to the start of the year.
As in 2016/17, around 1 in 5 LAC are in schools rated ‘Requires Improvement’ or ‘Inadequate’ in 2017/18 (Table 8).
Table 8: Proportions of LAC attending schools with each Ofsted rating
Initial school Ofsted Rating | 2017 | 2018 |
Outstanding | 18% (9,180) | 17% (9,500) |
Good | 60% (30,660) | 61% (33,130) |
Requires improvement | 17% (8,640) | 15% (8,120) |
Inadequate | 5% (2,810) | 5% (2,830) |
Not inspected yet | <1% (180) | 1% (800) |
There is considerable variation between LAs in these rates. For example, the proportion of LAC in Requires Improvement/Inadequate rated schools ranges from 3% to 42%.
Figure 14: Map of rates of LAC attending RI/Inadequate rated schools
Figure 15: Map of rates of LAC attending Good/Outstanding rated schools
There is a clear negative correlation between capacity in Good/Outstanding schools and the proportion of LAC in RI/Inadequate schools (Figure 16) - in other words, LAs with a higher number vacant places in Good/Outstanding schools are likely to have significantly smaller proportion of LAC in RI/Inadequate schools. However, while there is a clear negative correlation, this explains only 24% of the variation in the rates of LAC attending RI/Inadequate schools, suggesting other factors are also important5.
Figure 16: Correlation between average number of vacant places in Good/Outstanding schools in an LA against % of LAC in RI/Inadequate schools
The rate of LAC in an LA is also strongly correlated with higher rates of LAC in RI/Inadequate schools. This explains 17% of the variation between LAs and remains significant even once capacity in ‘Good/Outstanding’ rated schools has been accounted for. This correlation is consistent with the hypothesis that LAs prioritise the placement of LAC in Good/Outstanding schools, but that this is easier to achieve in LAs where the LAC population is smaller.
Once these factors are taken into account, budget per looked after child6, rates of teenage care entrants and legal status mix have statistically significant but small associations with rates of LAC in RI/inadequate schools (Figure 17). For example, an LA with a 5 percentage point higher than average rate of teenage care entrants is associated with having a 3pp higher rate of LAC in RI/Inadequate rated schools (after accounting for the aforementioned supply and demand factors).
Figure 17: Factors associated with % of LAC in RI/Inadequate schools after controlling for rate of LAC and vacant Good/Outstanding school places Note: Points indicate coefficient estimates based on a one standard deviation increase in a given factor after controlling for rate of LAC and average number of vacant Good/Outstanding school places. Horizontal lines equal 95% confidence intervals around these estimates.
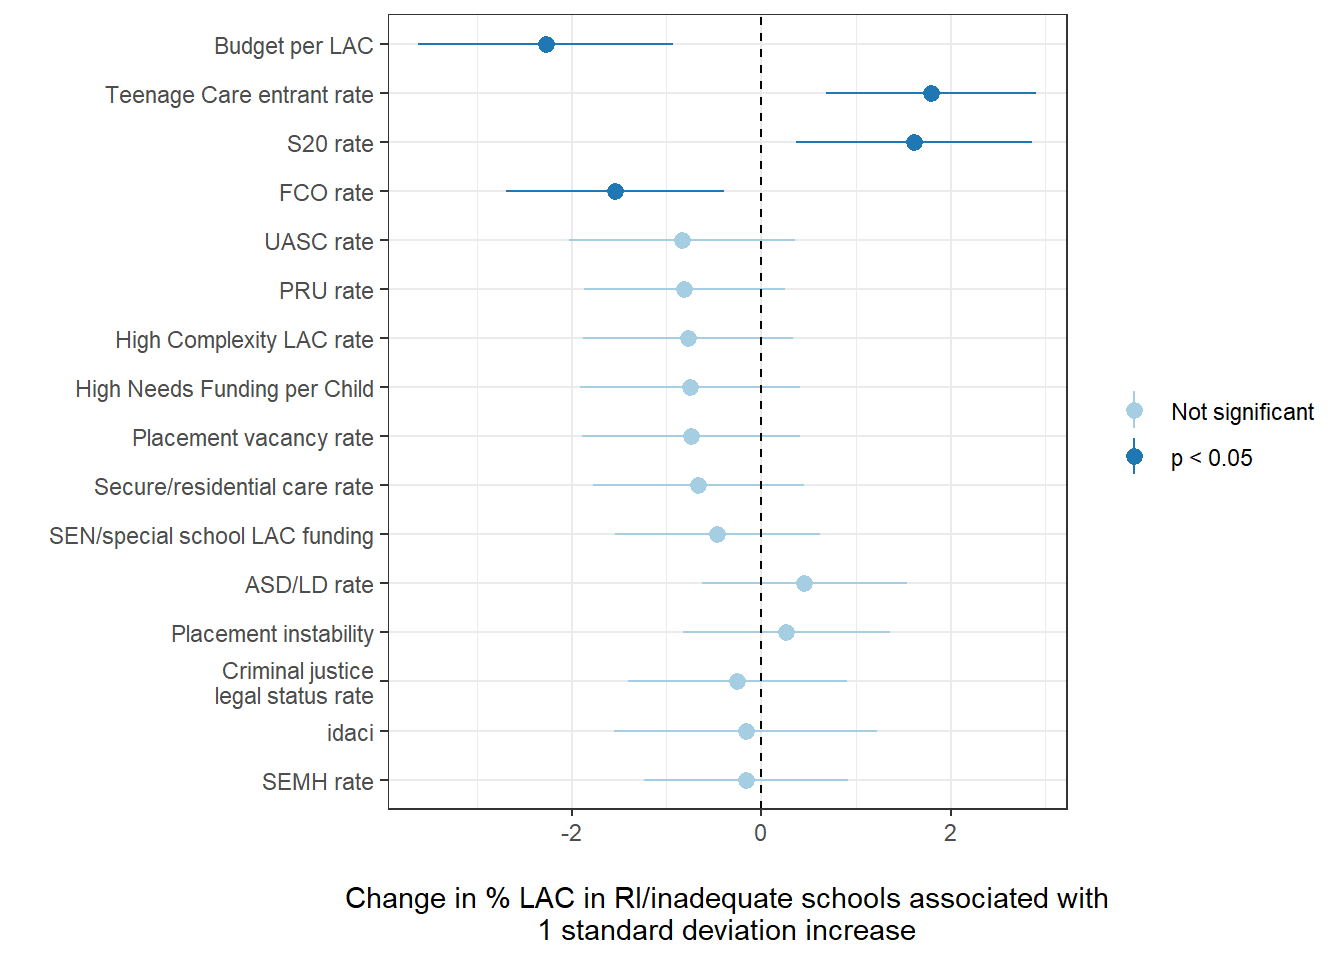
This shows there are some additional factors that could contribute to the proportion of LAC in RI/Inadequate schools, beyond the basic measures of supply and demand (although their explanatory power is small). Therefore many LAs will have a higher or lower proportion of LAC in RI/Inadequate schools, than would be expected given these two factors. But overall the general pattern is that LAs will have fewer LAC in RI/Inadequate schools if they have enough capacity in Good/Outstanding schools.
Some LAs have a large number of vacant places in Good/Outstanding schools, especially relative to their number of LAC in RI/Inadequate schools. In general these LAs have low rates of LAC in RI/Inadequate schools - but not always. Figure 18 shows this visually. The blue line is expected % of LAC in RI/inadequate schools in an LA given the number of vacant places in Good/Outstanding schools per LAC in RI/inadequate schools. The vertical distance between a data point and this blue line (its residual) demonstrates the degree to which looked after children over (or under)-represent in RI/Inadequate schools compared to this expected rate.
Limiting this to LAs with at least 25 vacant places in Good/Outstanding schools per LAC in RI/Inadequate rated schools, suggests 30 LAs had rate of LAC in RI/Inadequate schools that was at least 2.5 percentage points higher than would be expected (relative to the blue line). This includes 13 LAs where the rate was 5 percentage points higher than would be expected.
Figure 18: Relationship between vacant Good/Outstanding school places per LAC in RI/Inadequate schools, and % of LAC population in RI/inadequate schools Note: Blue line equals expected percentage of LAC in RI/Inadequate schools in an LA for a given number of vacant Good/Outstanding places for each of these LAC in RI/inadequate schools based on a loess smoothed average, span = 0.75
Rates of mid-year school moves are higher amongst LAC starting the year in schools with lower Ofsted ratings - see Table 9. Around 1 in 5 children in Inadequate rated schools at the start of the financial year experienced a mid-year school move compared to around 1 in 12 children in Outstanding rated schools. Rates of mid-year moves have also risen amongst children in RI/Inadequate schools, while they have fallen slightly in Good/Outstanding schools.
Table 9: Average rates of mid-year school moves by initial school Ofsted Rating
Initial school Ofsted Rating | % with mid-year move 2017 | % with mid-year move 2018 |
Outstanding | 9.3% (860) | 8.1% (770) |
Good | 12.3% (3,780) | 11% (3,660) |
Requires improvement | 13% (1,120) | 13.1% (1,060) |
Inadequate | 13.2% (370) | 19.2% (540) |
Not inspected yet | 15.9% (30) | 13.8% (110) |
When LAC in RI/Inadequate schools do have a mid-year move, it is not always the case that they move to a school with a higher Ofsted rating. Nearly 1 in 4 of those experiencing a mid-year school move from a RI/Inadequate rated school then moved to a second RI/Inadequate rated school (Figure 19). This is the lower than the percentage doing so from schools rated Good/Outstanding (13%).
Figure 19: Changes in school Ofsted rating for LAC experiencing a mid-year school move in 2017/18
![]()
Comparing children who move from an RI/Inadequate rated school to a second RI/Inadequate school, to those who move from RI/Inadequate schools to Good/Outstanding schools allows us to investigate which factors that may be associated with one type of transition but not the other.
As might be expected, the LA’s capacity of vacant Good/Outstanding places has a correlation with LAC moving to a second RI/Inadequate school. An increase of 10 more vacant places on average across its Good/Outstanding schools is associated with a 16% decrease in the odds of a child moving to a second RI/inadequate school at a mid-year school move.
Unaccompanied asylum seeking children are 4.3 times more likely to move to a second RI/inadequate school, compared to non UASC children with a mid-year school move that start the year in an RI/inadequate rated school.
Mid-year moves from one RI/Inadequate school to another do not seem to be clearly linked to placement changes. In fact, they are more likely to occur when there is not a placement change: children starting the year in an RI/Inadequate rated school were 46% more likely to move to a second RI/inadequate school if their school move was not within one month of a placement move, compared to if it was within a month of a placement move. This is further confirmed by the fact there is no link with multiple placement moves during the year.
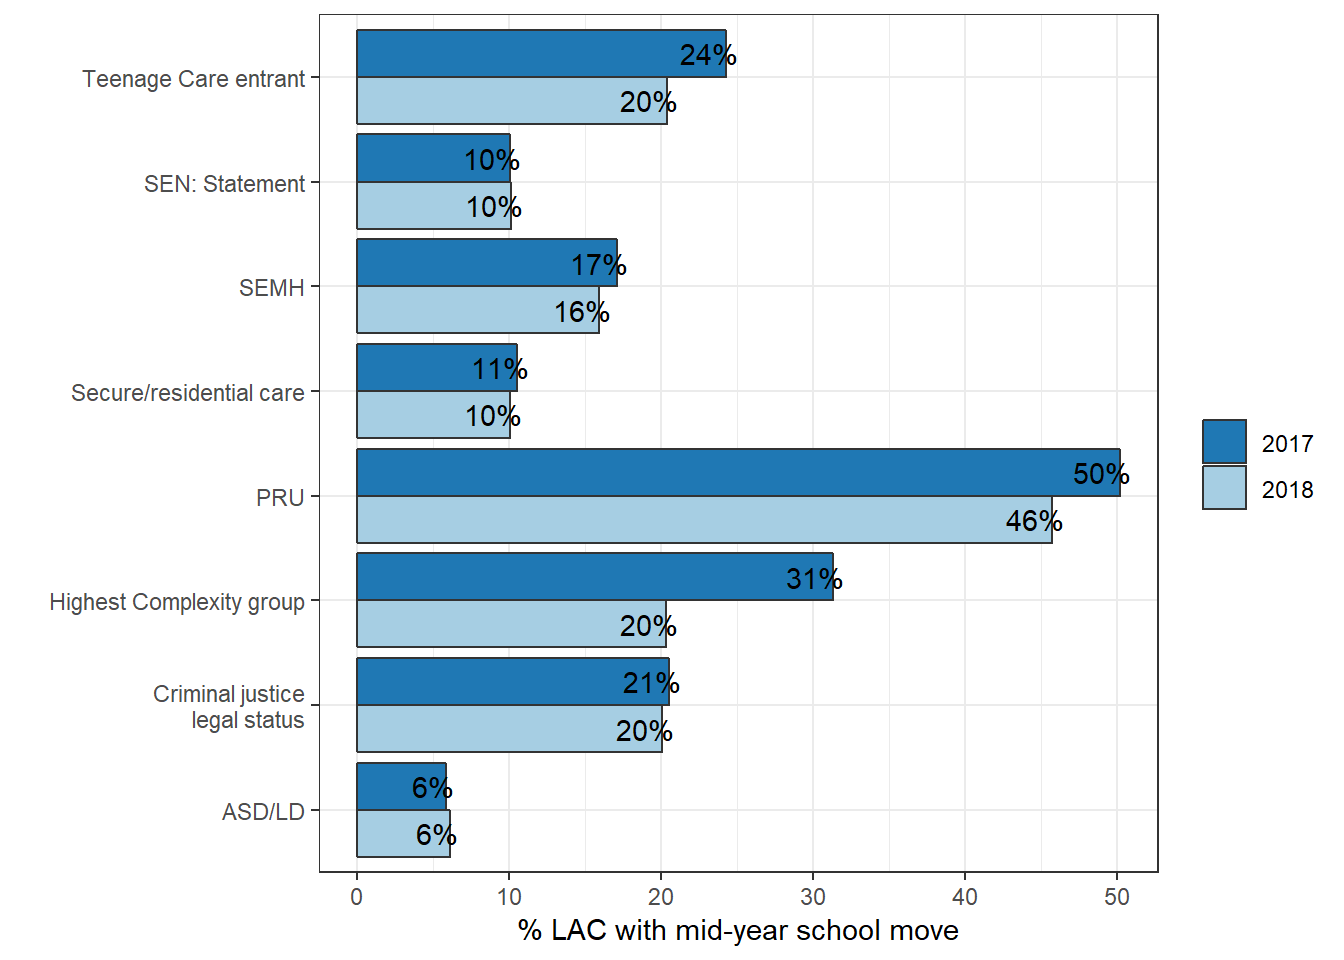
There are indications that rates of school instability amongst LAC with complex needs have improved slightly, particularly for teenage care entrants and LAC with contact time with a PRU (Figure 20). For both groups rates of mid-year school moves have dropped by around 4 percentage points since 2016/17.
Figure 20: Rates of mid-year school moves for LAC subgroups with complex needs
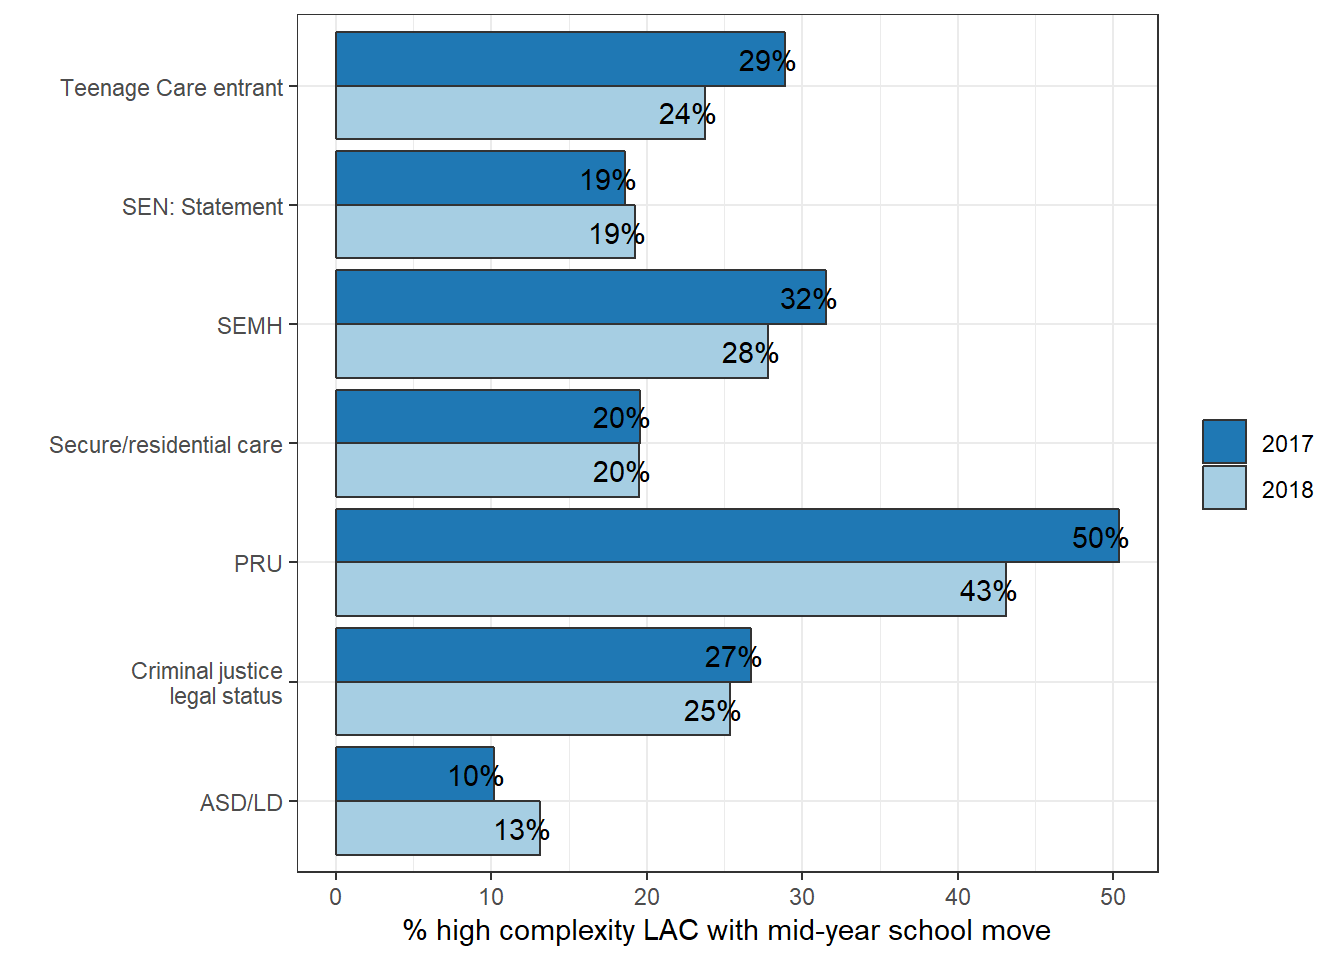
There is also a notable drop amongst in the highest complexity LAC group. Figure 21 demonstrates that this has been driven by slightly larger decreases in rates amongst children in this highest complexity group with SEMH as their primary SEN need and those with PRU contact compared to all looked after children.
Figure 21: Rates of mid-year school moves for LAC in the highest complexity group
However, there remains notable variation by local authority in rates of mid-year school moves for LAC with complex needs. Figure 22 demonstrates that even among a relatively higher stability group such as children with EHC plans, rates of mid-year school moves range from 2% to 40%. The widest range is amongst LAs with looked after children with PRU contact though this is likely the result of small base sizes for this group.
Figure 22: Local variation in rates of mid-year school moves for LAC subgroups with complex needs. Note: size of data point is proportionate to base size
Overall 27% of children looked after at 31st March 2018 experienced 2 or more changes of social worker (SW) in the previous 12 months (based on data from 140 LAs). This is equivalent to 20,350 children when scaled up to the full LAC population. Comparisons over time need some caution due to changes in our sample size over time as well as changes to collection methodology. However, amongst the 78 LAs that submitted data in 2016/17, the rate of children experiencing 2+ SW changes is broadly similar to last year at 26%.
The vast majority of these changes (83%) occur while children are in care. As a result, even when limited to changes whilst in care, 21% of children experienced 2 or more changes of social worker during 2017/18.
Just over half (54%) of changes of social worker are due to the child’s case transferring from one social worker team to another, as cases progresses through local systems and the structure of local authorities.
However, even once these moves are discounted, 10% (7,540) of children experienced multiple social worker moves in 2017/18 that were not due to a change in social worker team.
Looking over a longer time frame, Table 10 demonstrates that the vast majority of children in care - 81.8% - had experienced some form of social worker change over the past 2 years. Just over half - 55.4% - had experienced 2 or more changes over 2 years. There is also a notable minority (8% - 6,030 children) have experienced 2+ changes of social worker in both 2017/18 and 2016/17.
Table 10: Cumulative distribution of number of social worker changes experienced by LAC, over 1-2 years
Number of SW changes | % of LAC over 1 year | % of LAC over 2 years |
1+ | 60.6 | 81.8 |
2+ | 27 | 55.4 |
3+ | 9.5 | 32 |
4+ | 2.9 | 16.5 |
5+ | <1 | 7.6 |
6+ | <1 | 3.2 |
7+ | <1 | 1.3 |
As with last year there is considerable variation between LAs in the proportions of LAC experiencing multiple social worker changes in 2017/18. Rates range from 0% to 51% across LAs (note that this maximum excludes a local authority whose rate was 66%, but which only had 30 LAC on 31 March 2018). Some care must be taken when interpreting this variation, as there may be differences in how social worker assignment is recorded by different LAs as this data is not collected centrally.
Figure 23: Map of proportion of LAC experiencing multiple social worker changes in 2017/18
There also remains considerable variation by LA when we exclude social worker changes that also involve a change of social worker team. Rates of multiple SW changes excluding changes in team range from 0% to 33% across. Note: these percentages exclude LAs with no children with multiple social worker moves overall and 2 LAs that did not provide information on team changes.
Figure 24: Map of proportion of LAC experiencing multiple social worker changes not due to a change in SW team in 2017/18
Figure 25: Map of proportion of LAC experiencing multiple social worker changes due to a change in SW team in 2017/18
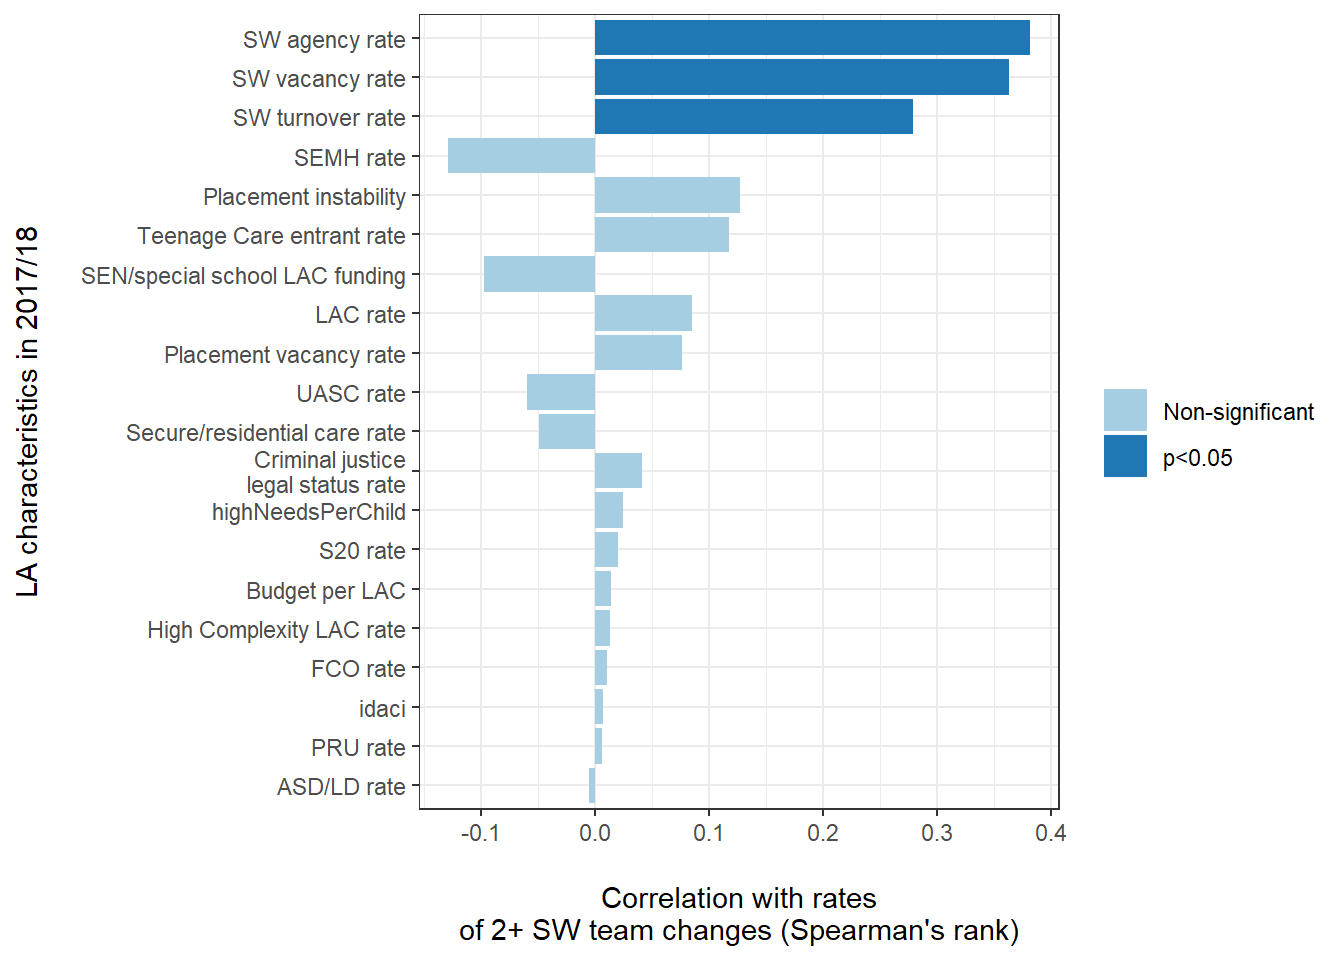
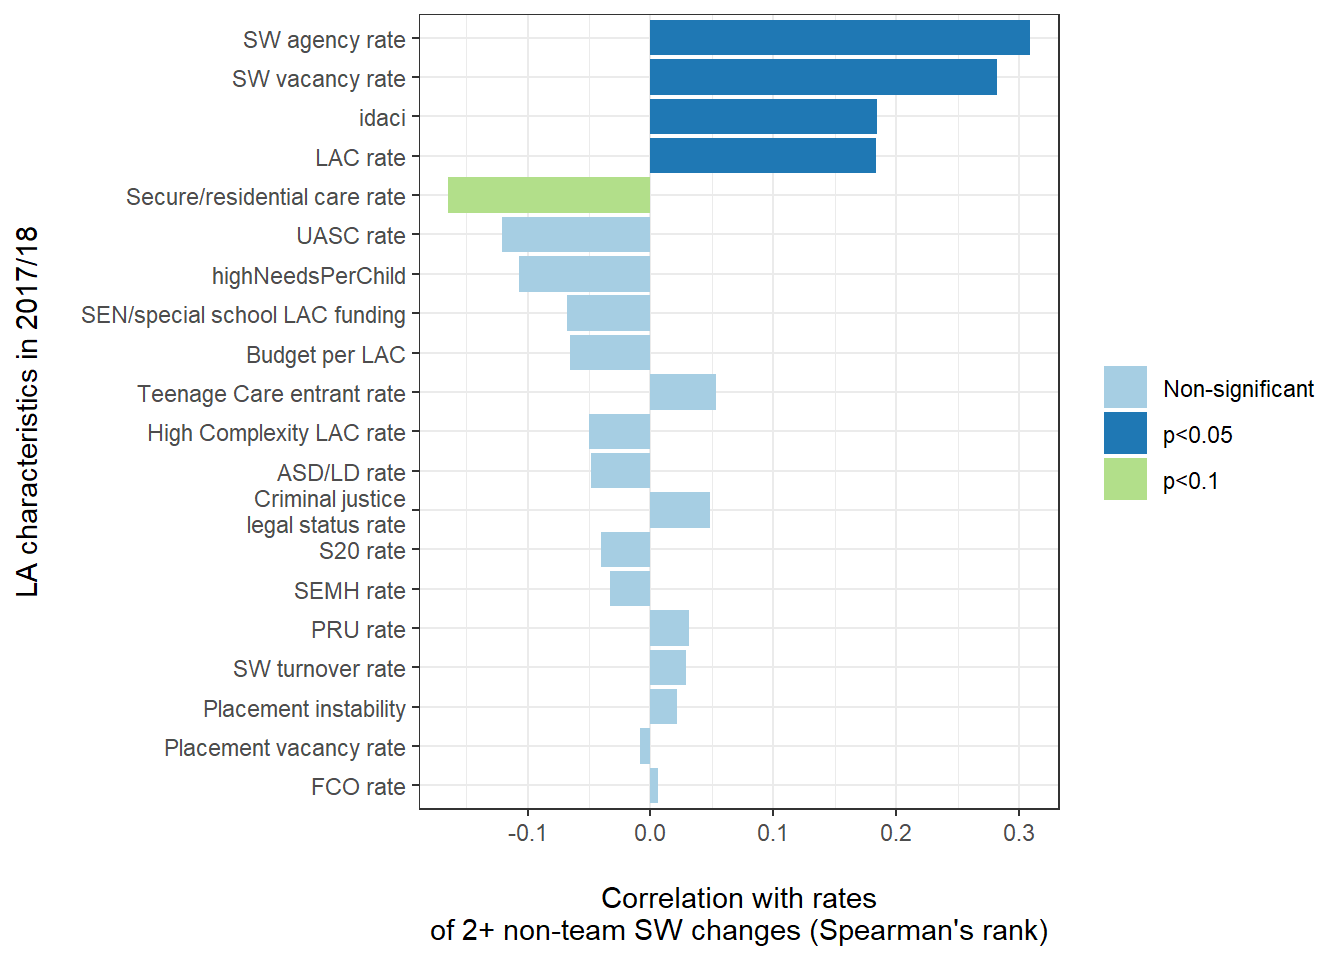
Factors relating to the local social work labour market - such as rates of agency staff, vacancies and staff turnover - have the strongest associations with higher rates of multiple social worker changes (Figure 26). For example LAs with a 10% higher than average rate of social worker turnover have on average 3 percentage point higher rates of children experiencing multiple social worker changes during the year. However, taken together these factors explain only 11% of the variation between LAs in rates of LAC experiencing multiple SW changes.
There are no statistically significant correlations with the characteristics of the case mix of the LA’s LAC cohort.
Figure 26: Correlations at LA level between various factors and rates of multiple social worker changes in 2017/18
Interestingly there are slight differences in the factors that predict multiple changes of social worker not related to a team and those that predict multiple moves across teams. Multiple changes not related to a change of social worker team are primarily related to staff turnover rates and use of agency staff (Figure 27). Taken together these workforce factors explain 11% of the variation between LAs in rates of multiple social worker moves not due to team changes.
Rates of multiple moves which are due to moving SW teams are also associated with higher agency staff and vacancy rates, but in addition there are also local authority factors with statistically significant associations - specifically higher rates of Looked After Children in an LA and greater deprivation in the local authority (Figure 28). Taken together these factors explain 17% of the variation between LAs in rates of multiple social worker moves due to SW team changes.
Figure 28: Correlations at LA level between various factors and rates of multiple social worker changes due to a change in team in 2017/18
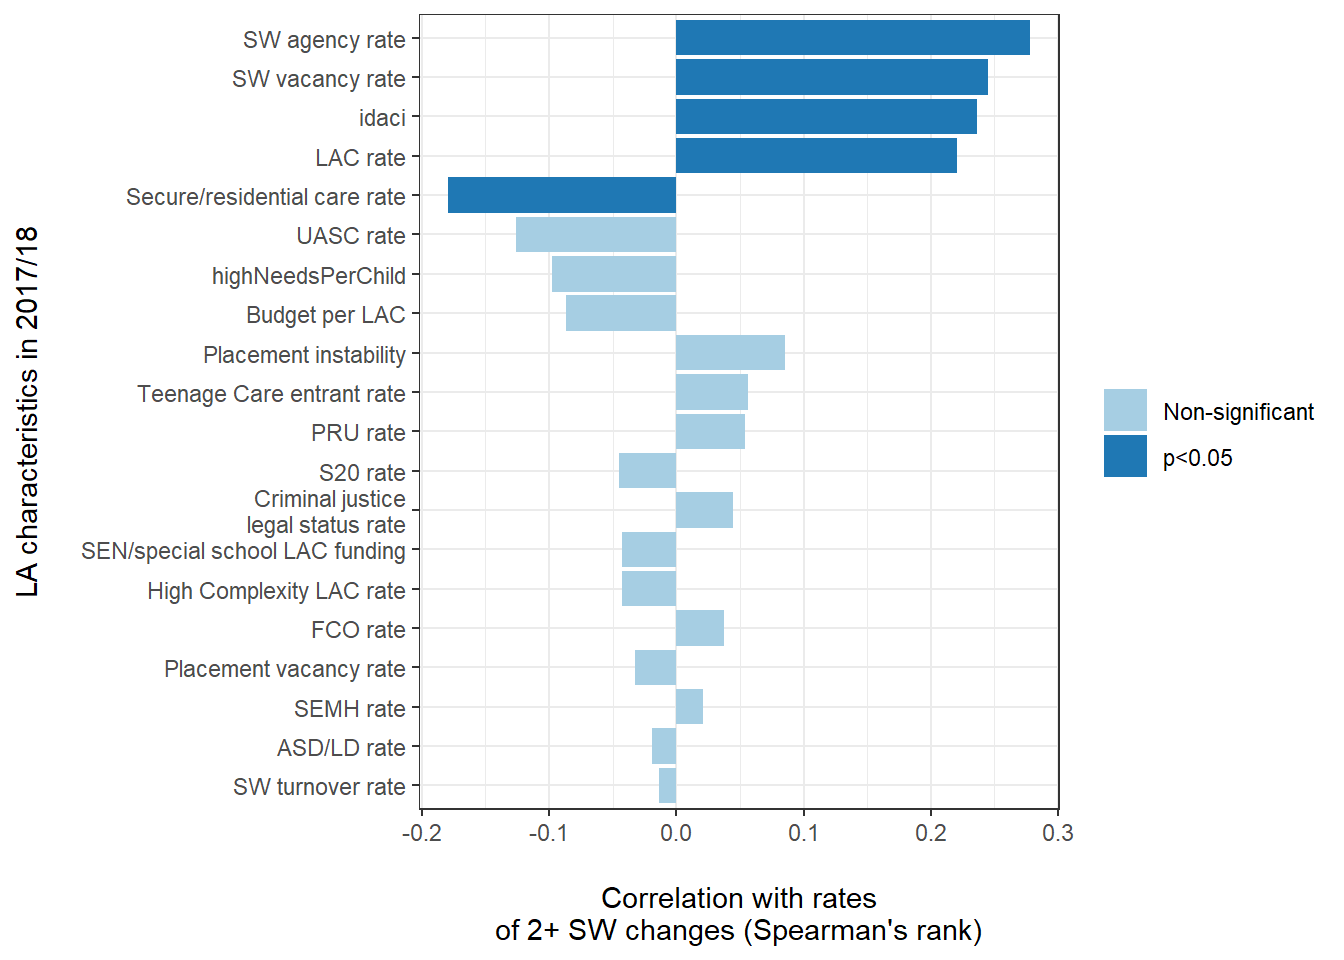
Figure 27: Correlations at LA level between various factors and rates of multiple social worker changes due to a change in team in 2017/18
There is a small correlation between rates of multiple social worker changes and the Ofsted rating of an LA’s Looked After Children services (Table 11). A child in an LA judged to be ‘Inadequate’ is 40% more likely to have experienced multiple social worker moves in 2017/18 than a child in an LA judged ‘Good’ or ‘Outstanding’. However even in LAs judged ‘Good’ or ‘Outstanding’ for LAC, it remains the case that 1 in 4 LAC experienced multiple social worker changes in 2017/18.
Table 11: Average rates of multiple social worker changes by LA LAC Ofsted rating
LA LAC Ofsted rating | % of LAC with 2+ social worker changes 2017/18 (n) |
Outstanding | 24% (540) |
Good | 24% (6,450) |
Requires improvement to be good | 28% (11,470) |
Inadequate | 34% (1,960) |
There appears to be a stronger relationship between this Ofsted rating and the likelihood of experiencing multiple social worker changes due to changes of team. Conversely, there is little relationship between Ofsted ratings and multiple social worker changes that are not due to a change in team; indeed these rates are slightly higher in local authorities rated Good/Outstanding (Table 12).
Table 12: Average rates of multiple social worker changes (not due to a change in team) by LA LAC Ofsted rating
LA LAC Ofsted rating | % of LAC with 2+ social worker changes not due to a change in team 2017/18 (n) |
Outstanding | 11% (240) |
Good | 11% (3,020) |
Requires improvement to be good | 9% (3,670) |
Inadequate | 8% (470) |
There is a much stronger correlation with rates of multiple social worker moves between teams. Children in an inadequate rate LA are 2.7 times more likely to experience multiple social worker moves due to a change in team (Table 13).
Table 13: Average rates of multiple social worker changes (due to a change in team) by LA LAC Ofsted rating
LA LAC Ofsted rating | % of LAC with 2+ social worker changes due to a change in team 2017/18 (n) |
Outstanding | 7% (160) |
Good | 7% (1,810) |
Requires improvement to be good | 13% (5,320) |
Inadequate | 19% (1,100) |
Note: percentages in this section are based on the sample of children in care at 31st March 2018 with available social worker, school and placement change information (n = 61,330).
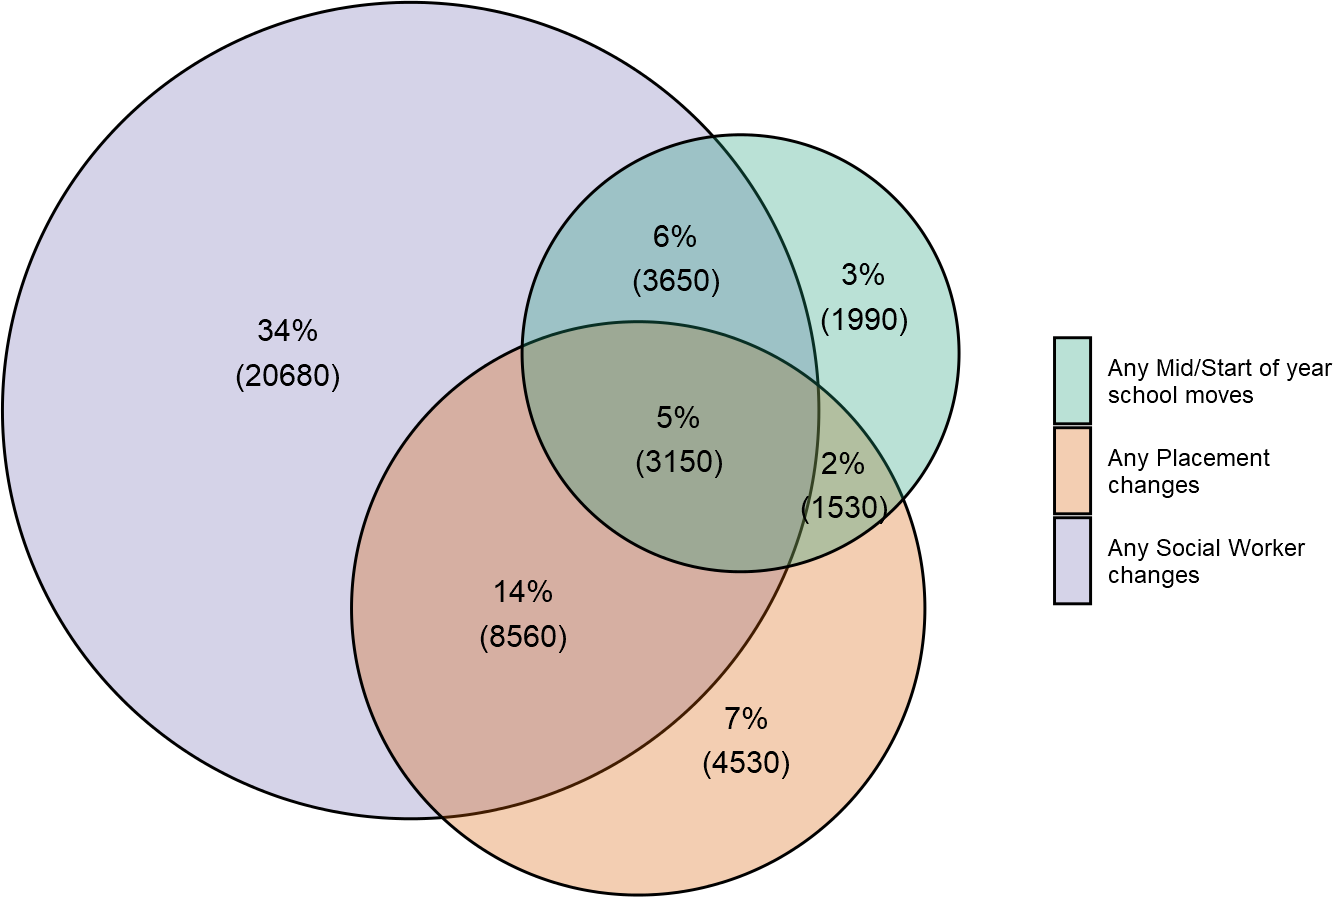
5% of LAC (3,100 children) experienced at least one social worker change, a placement change and a school move in 2017/18 (Figure 29). Overall 72% experienced any form of change in 2017/18. Direct comparisons with last year are difficult due to larger sample sizes and changes in methodology, however these figures are broadly in line with rates found in 2016/17.
Figure 29: Proportions of children experiencing combinations of instability in 2017/18
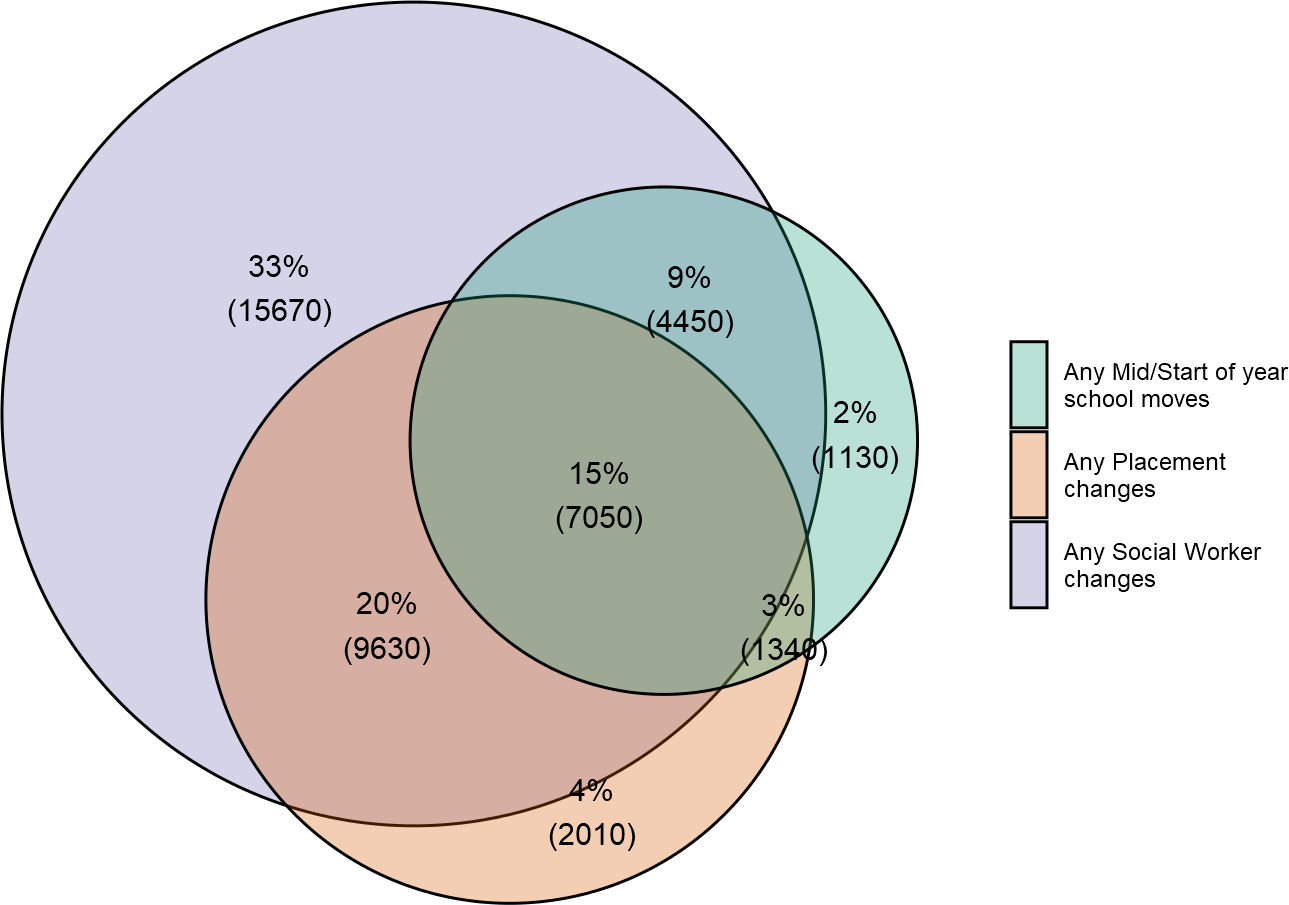
Looking over 2 years, 84% had experienced any form of instability defined as any placement change, school move or social worker change and 15% experienced at least one of each form of instability. Note this is limited to children in care at any point in both 2016/17 and 2017/18 (Figure 30).
Figure 30: Proportions of children experiencing combinations of instability over 2 years
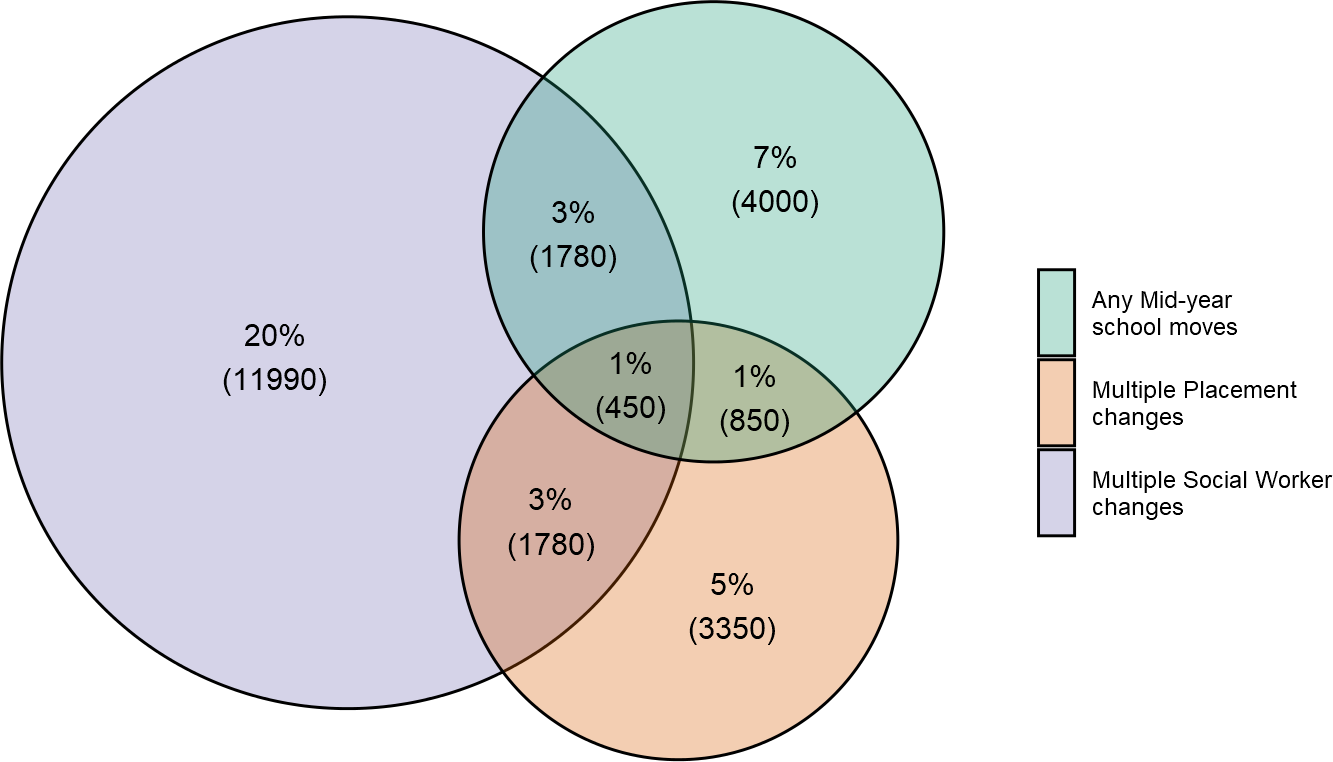
Around 1% of LAC experienced multiple placement changes, a mid-year school move and multiple social worker changes in 2017/18 (Figure 31). Again, this is difficult to compare with last year’s publication, however, is broadly similar to the rate last year.
Figure 31: Proportions of children experiencing multiple instability in 2017/18
The findings above demonstrate that overall there has been little change in stability for Looked After Children over the last 12 months. Key findings from this report are:
Placement Stability
School Stability
Social Worker Stability
Figure 32: Change in age breakdown of LAC at 31st March 2013-2018
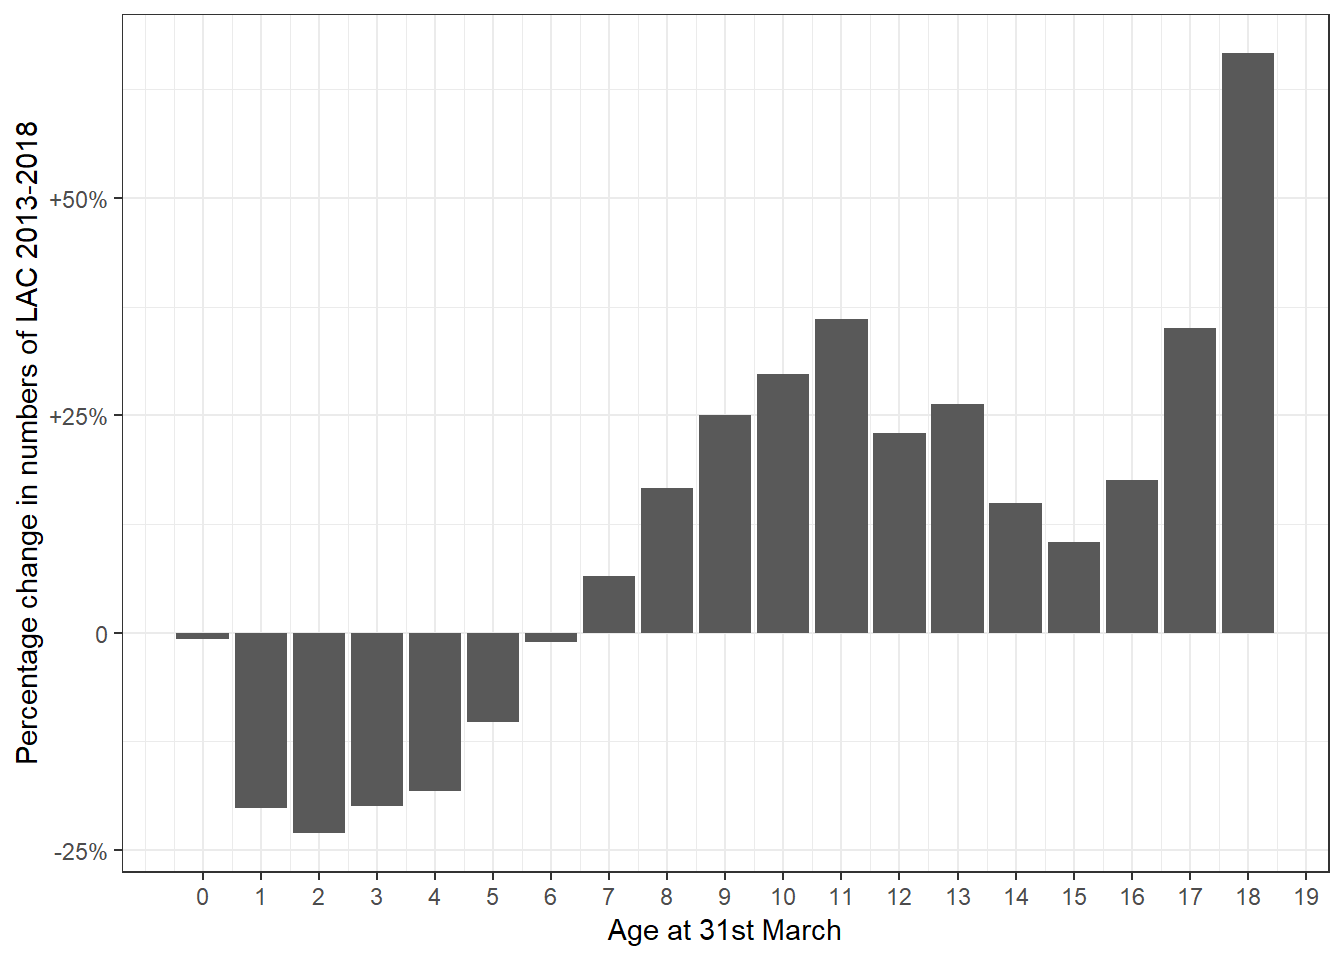
Table 14: Change in age breakdown of LAC at 31st March 2013-2018
Age at 31st March | CLA at 31st March 2013 | CLA at 31st March 2018 | Percentage change in number of LAC 2013 to 2018 | % of CLA at 31st March 2013 | % of CLA at 31st March 2018 | Percentage point change 2013 to 2018 |
0 | 4,310 | 4,280 | -0.8 | 6.3 | 5.7 | -0.6 |
1 | 3,800 | 3,030 | -20.1 | 5.6 | 4.0 | -1.6 |
2 | 3,030 | 2,330 | -23.1 | 4.5 | 3.1 | -1.4 |
3 | 2,780 | 2,230 | -19.9 | 4.1 | 3.0 | -1.1 |
4 | 2,710 | 2,220 | -18.2 | 4.0 | 2.9 | -1.1 |
5 | 2,540 | 2,270 | -10.3 | 3.7 | 3.0 | -0.7 |
6 | 2,600 | 2,570 | -1.1 | 3.8 | 3.4 | -0.4 |
7 | 2,570 | 2,740 | 6.5 | 3.8 | 3.6 | -0.2 |
8 | 2,730 | 3,180 | 16.6 | 4.0 | 4.2 | 0.2 |
9 | 2,820 | 3,530 | 25.0 | 4.1 | 4.7 | 0.6 |
10 | 3,030 | 3,930 | 29.7 | 4.5 | 5.2 | 0.7 |
11 | 3,170 | 4,310 | 36.1 | 4.7 | 5.7 | 1.0 |
12 | 3,600 | 4,430 | 23.0 | 5.3 | 5.9 | 0.6 |
13 | 3,950 | 4,990 | 26.3 | 5.8 | 6.6 | 0.8 |
14 | 4,860 | 5,580 | 14.9 | 7.1 | 7.4 | 0.3 |
15 | 5,850 | 6,460 | 10.4 | 8.6 | 8.6 | 0.0 |
16 | 6,730 | 7,910 | 17.6 | 9.9 | 10.5 | 0.6 |
17 | 6,970 | 9,420 | 35.0 | 10.2 | 12.5 | 2.3 |
18 | 0 | 0 | 66.7 | 0.0 | 0.0 | 0.0 |
19 | NA | 0 | 0.0 |
In 2018, teenage LAC were as likely to have any identified SEN as children aged under 13 (Table 15). However, within this they are slightly more likely to have a statement/EHC plan (24% vs 8% of those under 8 and 19% of those aged 8-12) and the least likely to have SEN support.
Looking over time, the proportion of teenage LAC with no identified special education needs has increased by 17pp and there has been a marked decline in the proportion of teenagers in care receiving SEN support (down 13pp since 2013). These changes are notably larger than for children aged under 13.
Table 15: Change in proportion of LAC with identified SEN 2013-2018
SEN provision | Age group | % of age group at 31st March 2013 (n) | % of age group at 31st March 2018 (n) | Percentage point change 2013 to 2018 |
No SEN | 0-7 | 51.8 (4,920) | 58.9 (4,800) | 7.1 |
8-12 | 33.4 (4,760) | 45.5 (8,110) | 12.1 | |
13+ | 31.3 (4,940) | 48.6 (8,850) | 17.3 | |
SEN statement/EHC | 0-7 | 9.2 (880) | 8.4 (690) | -0.8 |
8-12 | 22 (3,140) | 19.4 (3,460) | -2.6 | |
13+ | 28.3 (4,460) | 24.1 (4,380) | -4.2 | |
SEN support | 0-7 | 38.9 (3,690) | 32.6 (2,660) | -6.3 |
8-12 | 44.6 (6,370) | 35.1 (6,240) | -9.5 | |
13+ | 40.4 (6,360) | 27.3 (4,970) | -13.1 |
Table 16: Change in proportion of LAC with different primary SEN types 2013-2018
Primary SEN type | Age group | % of age group at 31st March 2013 (n) | % of age group at 31st March 2018 (n) | Percentage point change 2013 to 2018 |
Autism | 0-7 | 3.5 (110) | 3.5 (120) | 0.0 |
8-12 | 4 (290) | 4.8 (470) | 0.8 | |
13+ | 6.2 (550) | 7.5 (700) | 1.3 | |
BESD/SEMH | 0-7 | 34.3 (1,080) | 36.3 (1,210) | 2.0 |
8-12 | 44.3 (3,190) | 43.5 (4,220) | -0.8 | |
13+ | 47.7 (4,240) | 44.9 (4,200) | -2.8 | |
Moderate LD | 0-7 | 14.7 (460) | 14.8 (490) | 0.1 |
8-12 | 21.8 (1,570) | 21.4 (2,070) | -0.4 | |
13+ | 19.1 (1,700) | 18.2 (1,700) | -0.9 | |
Profound learning difficulties | 0-7 | 3.4 (110) | 2.7 (90) | -0.7 |
8-12 | 2.2 (160) | 1.4 (140) | -0.8 | |
13+ | 2.7 (240) | 2.1 (190) | -0.6 | |
Speech & language | 0-7 | 26.4 (830) | 26.9 (900) | 0.5 |
8-12 | 8.9 (640) | 10.8 (1,050) | 1.9 | |
13+ | 3.8 (340) | 5.6 (520) | 1.8 | |
Specific LD | 0-7 | 3 (90) | 3.2 (110) | 0.2 |
8-12 | 5.9 (420) | 6.1 (590) | 0.2 | |
13+ | 4.5 (400) | 7.3 (680) | 2.8 |
Table 17: Change in proportion of LAC with any PRU contact time 2014-2018
PRU | Age group | % of age group at 31st March 2014 (n) | % of age group at 31st March 2018 (n) | Percentage point change 2014 to 2018 |
Any contact time with a PRU | 0-7 | 0.1 (10) | 0.1 (10) | 0.0 |
8-12 | 0.5 (80) | 0.4 (80) | -0.1 | |
13+ | 4.1 (690) | 3.2 (580) | -0.9 | |
Not | 0-7 | 99.9 (9,610) | 99.9 (8,140) | 0.0 |
8-12 | 99.5 (15,000) | 99.6 (17,740) | 0.1 | |
13+ | 95.9 (16,260) | 96.8 (17,630) | 0.9 |
Similarly teenagers in care are notably more likely to be in residential/secure care than younger children in 2018 (3.2% vs 0.6% of LAC aged 8-12 - Table 18). However this proportion has again decreased slightly since 2013 (down 2pp).
The proportion in independent or semi-independent living has increased slightly during the same time period (up 4pp to 14.8% of teenage LAC in 2018).
The starkest divergence has been the much greater increase amongst teenagers in long term foster placements (not including those placed with family or friends). This has increased by nearly 10pp since 2013, compared to a 3pp increase for LAC aged 8-12.
Note: by long term this does not refer to the amount of time the child has been in a placement. Rather it refers to the fact that the foster placement is intended as the child’s home for the foreseeable future as opposed to (for example) being fostered while adoption planning is going on concurrently.
Table 18: Change in proportion of LAC by selected placement types 2013-2018
Placement type | Age group | % of age group at 31st March 2013 (n) | % of age group at 31st March 2018 (n) | Percentage point change 2013 to 2018 |
(Semi-)independent living | 0-7 | 0 (0) | 0 (10) | 0.0 |
13+ | 11 (3,130) | 14.8 (5,100) | 3.8 | |
Long term foster placement not with family or friends | 0-7 | 8 (1,940) | 9.3 (2,010) | 1.3 |
8-12 | 30.6 (4,700) | 34 (6,590) | 3.4 | |
13+ | 15.8 (4,490) | 25.4 (8,740) | 9.6 | |
Other placement type | 0-7 | 91.9 (22,360) | 90.3 (19,570) | -1.6 |
8-12 | 68.6 (10,530) | 65.4 (12,680) | -3.2 | |
13+ | 67.8 (19,240) | 56.5 (19,420) | -11.3 | |
Residential/secure placement | 0-7 | 0.1 (30) | 0.4 (80) | 0.3 |
8-12 | 0.8 (120) | 0.6 (120) | -0.2 | |
13+ | 5.3 (1,510) | 3.2 (1,100) | -2.1 |
Table 19: Change in proportion of LAC in public/privately provided placements 2013-2018
Provision type | Age group | % of age group at 31st March 2013 (n) | % of age group at 31st March 2018 (n) | Percentage point change 2013 to 2018 |
LA/public provision | 0-7 | 73.2 (17,810) | 70.4 (15,210) | -2.8 |
8-12 | 59.5 (9,120) | 56.5 (10,940) | -3.0 | |
13+ | 49.8 (14,060) | 43.6 (14,960) | -6.2 | |
Other provision | 0-7 | 9.3 (2,250) | 14.6 (3,150) | 5.3 |
8-12 | 8.7 (1,330) | 10.2 (1,980) | 1.5 | |
13+ | 7.6 (2,140) | 10 (3,440) | 2.4 | |
Private provision | 0-7 | 17.5 (4,260) | 15 (3,240) | -2.5 |
8-12 | 31.9 (4,890) | 33.2 (6,430) | 1.3 | |
13+ | 42.6 (12,010) | 46.4 (15,920) | 3.8 |
Table 20: Change in proportion of LAC by placement and public/private provision 2013-2018
Provision type | Age group | % of age group at 31st March 2013 (n) | % of age group at 31st March 2018 (n) | Percentage point change 2013 to 2018 |
(Semi-)independent living: LA/public provision | 0-7 | 0 (0) | 0 (0) | 0.0 |
13+ | 2.7 (750) | 2.4 (830) | -0.3 | |
(Semi-)independent living: Private provision | 0-7 | 0 (0) | 0 (0) | 0.0 |
13+ | 7.5 (2,110) | 11.2 (3,860) | 3.7 | |
Long term foster placement not with family or friends: LA/public provision | 0-7 | 4.8 (1,180) | 6 (1,300) | 1.2 |
8-12 | 18.7 (2,860) | 19.5 (3,770) | 0.8 | |
13+ | 9.8 (2,780) | 14.3 (4,920) | 4.5 | |
Long term foster placement not with family or friends: Private provision | 0-7 | 2.7 (660) | 2.9 (630) | 0.2 |
8-12 | 10.4 (1,600) | 12.7 (2,450) | 2.3 | |
13+ | 5.5 (1,550) | 9.7 (3,330) | 4.2 | |
Residential/secure placement: LA/public provision | 0-7 | 0.1 (20) | 0.2 (50) | 0.1 |
8-12 | 0.1 (20) | 0.1 (20) | 0.0 | |
13+ | 1.9 (540) | 1.4 (470) | -0.5 | |
Residential/secure placement: Private provision | 0-7 | 0 (0) | 0.1 (20) | 0.1 |
8-12 | 0.6 (100) | 0.5 (90) | -0.1 | |
13+ | 3.1 (860) | 1.6 (540) | -1.5 |
Note: only 40% of children in care at 31st March have matched factors at assessment. This is likely due to them having come into the children’s services system prior to 2014/15
as factors identified at their assessment than younger LAC (Table 21).
Table 21: Factors at CIN assessment for children in care at 31st March 2018
Factor at assessment | % of LAC aged 0-7 at 31st March 2018 (n) | % of LAC aged 8-12 at 31st March 2018 (n) | % of LAC aged 13+ at 31st March 2018 (n) |
Going missing | 1.5 (250) | 3.4 (360) | 14.9 (3,090) |
Child Sexual Exploitation | 1.7 (290) | 3 (320) | 12.3 (2,550) |
Trafficking | 0.3 (50) | 0.5 (50) | 5 (1,030) |
Gangs | 0.6 (100) | 1.1 (120) | 5.1 (1,070) |
Socially unacceptable behaviour | 4.9 (830) | 10.6 (1,120) | 18.9 (3,920) |
Self-harm | 2.3 (380) | 5.2 (550) | 12.1 (2,520) |
Abuse or neglect - neglect | 58.3 (9,870) | 42.4 (4,470) | 22.3 (4,620) |
Abuse or neglect - emotional abuse | 43.8 (7,420) | 40 (4,220) | 25.4 (5,270) |
Abuse or neglect - physical abuse | 27.9 (4,720) | 22.6 (2,390) | 13.8 (2,860) |
Abuse or neglect - sexual abuse | 7.1 (1,200) | 8.7 (920) | 8.7 (1,810) |
Alcohol misuse: child | 2.1 (360) | 2.1 (220) | 7 (1,450) |
Alcohol misuse: parent/carer | 25.4 (4,300) | 22.9 (2,410) | 12.9 (2,670) |
Alcohol misuse: another person | 5.8 (980) | 4.6 (480) | 2.7 (560) |
Other | 16.5 (2,790) | 19.8 (2,090) | 19.3 (4,010) |
No factors identified | 3.7 (620) | 7.2 (760) | 6 (1,250) |
Female genital mutilation | 0.1 (10) | 0.1 (10) | 0.1 (30) |
Abuse linked to faith or belief | 0.2 (40) | 0.3 (40) | 0.6 (130) |
Drug misuse: child | 3.5 (580) | 3.1 (320) | 12.1 (2,520) |
Drug misuse: parent/carer | 37.1 (6,280) | 24.7 (2,610) | 10.9 (2,250) |
Drug misuse: another person | 8.9 (1,510) | 5.9 (630) | 3.1 (650) |
Domestic violence: child subject | 16.8 (2,850) | 13.9 (1,460) | 9.8 (2,030) |
Domestic violence: parent/carer subject | 47 (7,960) | 33.3 (3,510) | 17 (3,520) |
Domestic violence: another person subject | 9.9 (1,680) | 7.3 (770) | 4.3 (890) |
Mental health: child | 6.9 (1,160) | 15.2 (1,600) | 23.5 (4,860) |
Mental health: parent/carer | 48.5 (8,200) | 36.3 (3,830) | 21 (4,360) |
Mental health: another person | 7.3 (1,230) | 5.8 (610) | 3.7 (770) |
Learning disability: child | 5.6 (950) | 13.5 (1,430) | 13.2 (2,730) |
Learning disability: parent/carer | 13.1 (2,220) | 6.7 (710) | 3.6 (740) |
Learning disability: another person | 2.6 (440) | 1.9 (200) | 1.8 (370) |
Physical disability or illness: child | 4.9 (830) | 6.1 (650) | 5.1 (1,060) |
Physical disability or illness: parent/carer | 5.6 (950) | 7.3 (770) | 5.9 (1,210) |
Physical disability or illness: another person | 1.6 (270) | 1.4 (150) | 1.5 (310) |
Young carer | 3.9 (660) | 7.4 (780) | 4.7 (970) |
UASC | 0.1 (10) | 0.5 (50) | 20.3 (4,210) |
Better match rates are available when we look at children entering care during the financial year that also had their CIN referral in the same financial year (match rates of over 80% since 2014/15).
Table 22 shows similar over-representations to the table above, though also demonstrates that there has been a small growth over time in the proportion with gangs identified as a factor at assessment (up 3pp since 2015) and where the child’s mental health is identified as a factor (up 4.5pp).
Table 22: Changes in factors at CIN assessment for LAC entering care 2013-2018
Factors at assessment | Age group | % of age group at 31st March 2015 (n) | % of age group at 31st March 2018 (n) | Percentage point change 2015 to 2018 |
Abuse linked to faith or belief | 0-7 | 0 (0) | 0.5 (40) | 0.5 |
8-12 | 0 (0) | 1.5 (30) | 1.5 | |
13+ | 0 (0) | 1.7 (70) | 1.7 | |
Abuse or neglect - emotional abuse | 0-7 | 34 (1,340) | 41.1 (2,740) | 7.1 |
8-12 | 41.3 (550) | 46.4 (920) | 5.1 | |
13+ | 23.7 (700) | 28.5 (1,170) | 4.8 | |
Abuse or neglect - neglect | 0-7 | 48 (1,900) | 56.8 (3,800) | 8.8 |
8-12 | 36.7 (480) | 45.6 (900) | 8.9 | |
13+ | 16.2 (480) | 23.1 (950) | 6.9 | |
Abuse or neglect - physical abuse | 0-7 | 32.1 (1,270) | 32.6 (2,180) | 0.5 |
8-12 | 38.5 (510) | 35.3 (700) | -3.2 | |
13+ | 19.8 (590) | 19.9 (820) | 0.1 | |
Abuse or neglect - sexual abuse | 0-7 | 5.7 (220) | 6.8 (450) | 1.1 |
8-12 | 7.6 (100) | 8.5 (170) | 0.9 | |
13+ | 8.4 (250) | 9.9 (410) | 1.5 | |
Alcohol misuse: another person | 0-7 | 4.4 (170) | 5 (330) | 0.6 |
8-12 | 3.3 (40) | 4.3 (90) | 1.0 | |
13+ | 2.3 (70) | 2.3 (100) | 0.0 | |
Alcohol misuse: child | 0-7 | 1.9 (80) | 1.8 (120) | -0.1 |
8-12 | 1.4 (20) | 2.6 (50) | 1.2 | |
13+ | 11 (330) | 9.4 (390) | -1.6 | |
Alcohol misuse: parent/carer | 0-7 | 19.8 (780) | 24.5 (1,640) | 4.7 |
8-12 | 16 (210) | 24.2 (480) | 8.2 | |
13+ | 9.9 (290) | 11 (450) | 1.1 | |
Child Sexual Exploitation | 0-7 | 1.2 (50) | 1.7 (120) | 0.5 |
8-12 | 2.1 (30) | 3.9 (80) | 1.8 | |
13+ | 13.2 (390) | 15 (620) | 1.8 | |
Domestic violence: another person subject | 0-7 | 7.1 (280) | 9.2 (610) | 2.1 |
8-12 | 5.4 (70) | 8.6 (170) | 3.2 | |
13+ | 5.3 (160) | 5.3 (220) | 0.0 | |
Domestic violence: child subject | 0-7 | 13.6 (540) | 15.2 (1,020) | 1.6 |
8-12 | 12.5 (160) | 14.9 (300) | 2.4 | |
13+ | 13.3 (400) | 12.8 (520) | -0.5 | |
Domestic violence: parent/carer subject | 0-7 | 34.8 (1,370) | 45.2 (3,020) | 10.4 |
8-12 | 24.8 (330) | 34 (670) | 9.2 | |
13+ | 15.9 (470) | 17.1 (700) | 1.2 | |
Drug misuse: another person | 0-7 | 5.5 (220) | 8.2 (550) | 2.7 |
8-12 | 3.2 (40) | 6.8 (140) | 3.6 | |
13+ | 2.8 (80) | 2.9 (120) | 0.1 | |
Drug misuse: child | 0-7 | 2.9 (120) | 3.6 (240) | 0.7 |
8-12 | 2.5 (30) | 3.1 (60) | 0.6 | |
13+ | 24.7 (740) | 22.3 (910) | -2.4 | |
Drug misuse: parent/carer | 0-7 | 25.5 (1,010) | 36.1 (2,410) | 10.6 |
8-12 | 14.1 (190) | 24.6 (490) | 10.5 | |
13+ | 6.1 (180) | 9.2 (380) | 3.1 | |
Female genital mutilation | 0-7 | 0 (0) | 0.3 (20) | 0.3 |
8-12 | 0 (0) | 0.8 (20) | 0.8 | |
13+ | 0 (0) | 0.4 (20) | 0.4 | |
Gangs | 0-7 | 0.5 (20) | 0.7 (40) | 0.2 |
8-12 | 0.9 (10) | 1.4 (30) | 0.5 | |
13+ | 7.8 (230) | 11 (450) | 3.2 | |
Going missing | 0-7 | 1.1 (40) | 1.7 (110) | 0.6 |
8-12 | 3.4 (40) | 4.9 (100) | 1.5 | |
13+ | 19.2 (570) | 20.4 (840) | 1.2 | |
Learning disability: another person | 0-7 | 1.7 (70) | 2.5 (170) | 0.8 |
8-12 | 1.3 (20) | 1.3 (20) | 0.0 | |
13+ | 1.2 (40) | 1.2 (50) | 0.0 | |
Learning disability: child | 0-7 | 3.7 (150) | 3.3 (220) | -0.4 |
8-12 | 9.2 (120) | 9 (180) | -0.2 | |
13+ | 9.3 (280) | 8.2 (340) | -1.1 | |
Learning disability: parent/carer | 0-7 | 9.4 (370) | 12.8 (860) | 3.4 |
8-12 | 3.5 (50) | 3.9 (80) | 0.4 | |
13+ | 1.7 (50) | 1.9 (80) | 0.2 | |
Mental health: another person | 0-7 | 5.4 (210) | 6.8 (460) | 1.4 |
8-12 | 4.2 (60) | 5.2 (100) | 1.0 | |
13+ | 3.3 (100) | 3.9 (160) | 0.6 | |
Mental health: child | 0-7 | 4.6 (180) | 5.7 (380) | 1.1 |
8-12 | 12.3 (160) | 16 (320) | 3.7 | |
13+ | 23.5 (700) | 28 (1,140) | 4.5 | |
Mental health: parent/carer | 0-7 | 34.4 (1,360) | 48.6 (3,250) | 14.2 |
8-12 | 27.2 (360) | 39.8 (790) | 12.6 | |
13+ | 15 (450) | 21.5 (880) | 6.5 | |
No factors identified | 0-7 | 1.4 (60) | 3.2 (220) | 1.8 |
8-12 | 2.4 (30) | 3.5 (70) | 1.1 | |
13+ | 2.3 (70) | 4.6 (190) | 2.3 | |
Other | 0-7 | 20.2 (800) | 14.8 (990) | -5.4 |
8-12 | 17.7 (230) | 12.7 (250) | -5.0 | |
13+ | 23.5 (700) | 18.7 (770) | -4.8 | |
Physical disability or illness: another person | 0-7 | 1.4 (60) | 1.5 (100) | 0.1 |
8-12 | 0.6 (10) | 1.2 (20) | 0.6 | |
13+ | 1 (30) | 1.2 (50) | 0.2 | |
Physical disability or illness: child | 0-7 | 3.7 (150) | 3.2 (210) | -0.5 |
8-12 | 3.5 (50) | 4.6 (90) | 1.1 | |
13+ | 3.3 (100) | 3.1 (130) | -0.2 | |
Physical disability or illness: parent/carer | 0-7 | 4.3 (170) | 5.9 (400) | 1.6 |
8-12 | 5.4 (70) | 8.9 (180) | 3.5 | |
13+ | 4.9 (150) | 6.4 (260) | 1.5 | |
Self-harm | 0-7 | 1.5 (60) | 2.1 (140) | 0.6 |
8-12 | 4.6 (60) | 5.4 (110) | 0.8 | |
13+ | 16.2 (480) | 14.6 (600) | -1.6 | |
Socially unacceptable behaviour | 0-7 | 3.4 (140) | 3.4 (230) | 0.0 |
8-12 | 8.3 (110) | 10.2 (200) | 1.9 | |
13+ | 29.9 (890) | 27 (1,110) | -2.9 | |
Trafficking | 0-7 | 0.8 (30) | 0.5 (40) | -0.3 |
8-12 | 1.3 (20) | 1 (20) | -0.3 | |
13+ | 3.1 (90) | 4.6 (190) | 1.5 | |
UASC | 0-7 | 0.2 (10) | 0.1 (0) | -0.1 |
8-12 | 0.2 (0) | 0.2 (0) | 0.0 | |
13+ | 6.5 (190) | 8.4 (340) | 1.9 | |
Young carer | 0-7 | 2.2 (90) | 3.2 (210) | 1.0 |
8-12 | 7.5 (100) | 8.6 (170) | 1.1 | |
13+ | 4 (120) | 4.6 (190) | 0.6 |
As mentioned in the main body of this report, the CLA census only contains proxy measures of children with complex needs. These indicators are interesting to examine individually but it is also useful to combine these to provide a summary of the relative complexity of a child’s needs. Creating these summary scores is the focus of this section.
One challenge with the available indicators in the CLA census is that some are much more proximate indicators of complex need than others. For example, teenage care entrants are a large and diverse group and though many will have complex needs this is not necessarily the case for all. As a result it is helpful to downweight more proximate indicators and upweight more direct measures.
Factor analysis provides a data led method for deciding on the degree to which indicators should be up or downweighted. This assumes that we can’t directly measure complex need with the available indicators - it acts as an underlying (latent) factor. However, we do have proxies and that the joint variation (correlation) in these proxy measures can be explained by differences in children’s complexity of need plus some level of error. The degree to which the variation in a proxy measure is explained by its correlation with this underlying factor provides a relative weighting for each indicator.
This creates a model to predict levels of these proxy indicators in a person if correlations between indicators were explained by this underlying factor. We can then assess how well this model fits based on how well it recreates the observed patterns of these proxy indicators. The added advantage of this model based approach is that it can be used to calculate these scores in other samples.
It may be though that 1 factor is not sufficient to explain the variation in these proxies and so this model can be varied to have multiple underlying factors, until a good fit is found. However, interpretation is important here as well as indicators of how well the model fits.
The following measures from the linked CLA and NPD samples were used as proxies for the complexity of a child’s need:
Note: the indicators used are all binary and as such factor analysis is performed on the tetrachoric correlation matrix
To allow comparisons over time the model is fit to both the 2016/17 and 2017/18 cohorts of looked after children (with a clustering term included to account for children in both cohorts)
Appendix Table 8 demonstrates common fit indices for a 1 and 2 factor model, suggesting that 2 factors are the most appropriate fit for these indicators.
Appendix Table 8: Fit indices for 1 and 2 factor models of complex need
Factors | CFI | TLI | RMSEA | SRMR |
1 | 0.906 | 0.843 | 0.059 (0.057, 0.061) | 0.181 |
2 | 0.978 | 0.918 | 0.042 (0.04, 0.045) | 0.081 |
Examining the factor loadings of this 2 factor model (Figure 33), suggests the factors can be interpreted as:
Figure 33: Factor loadings for 2 factor model
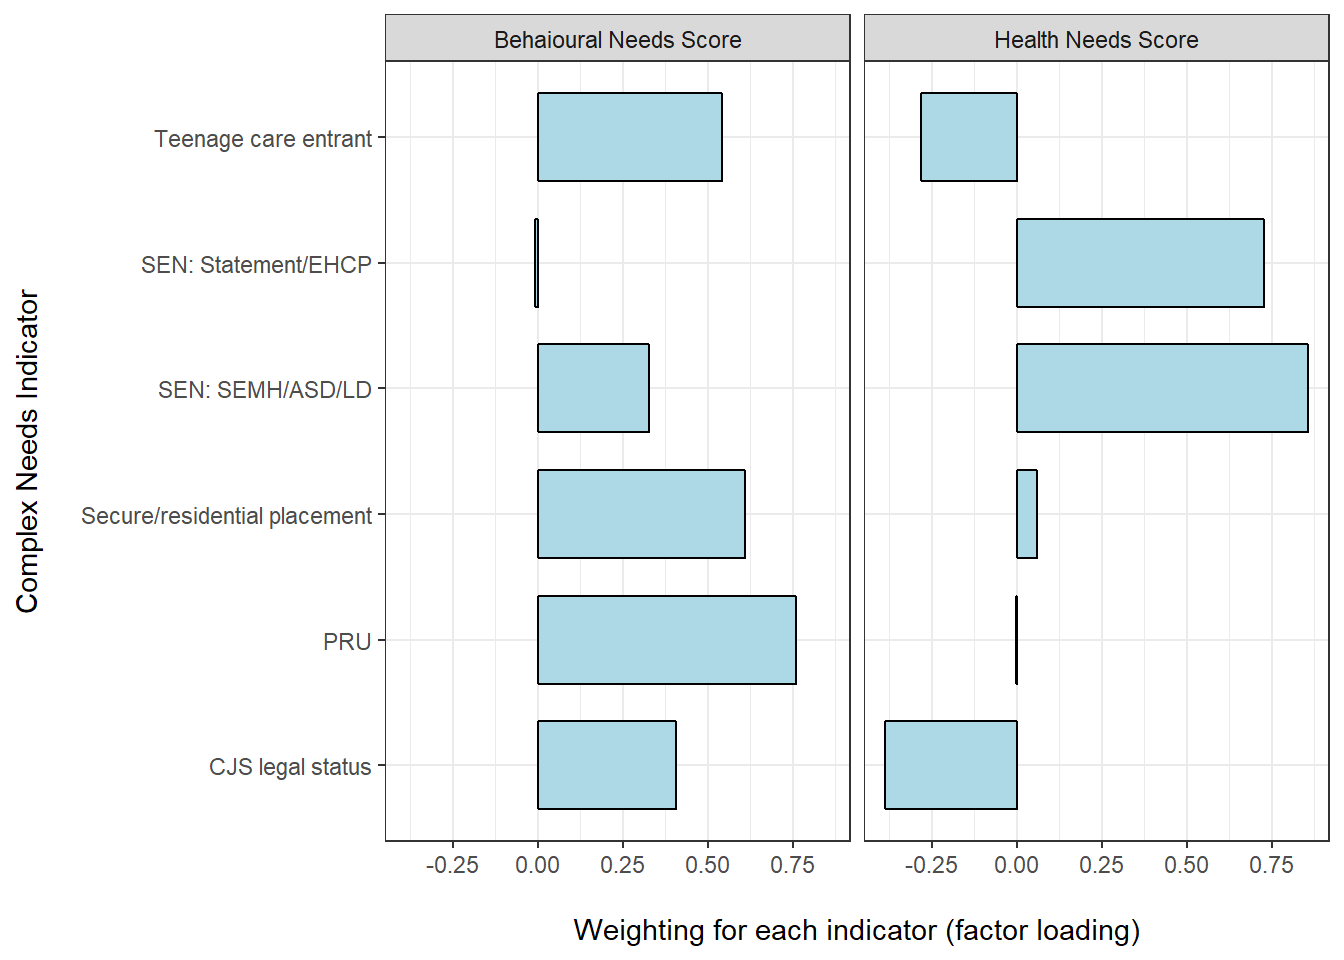
This then allows summary (factor) scores on both of these measures to be calculated for each child.
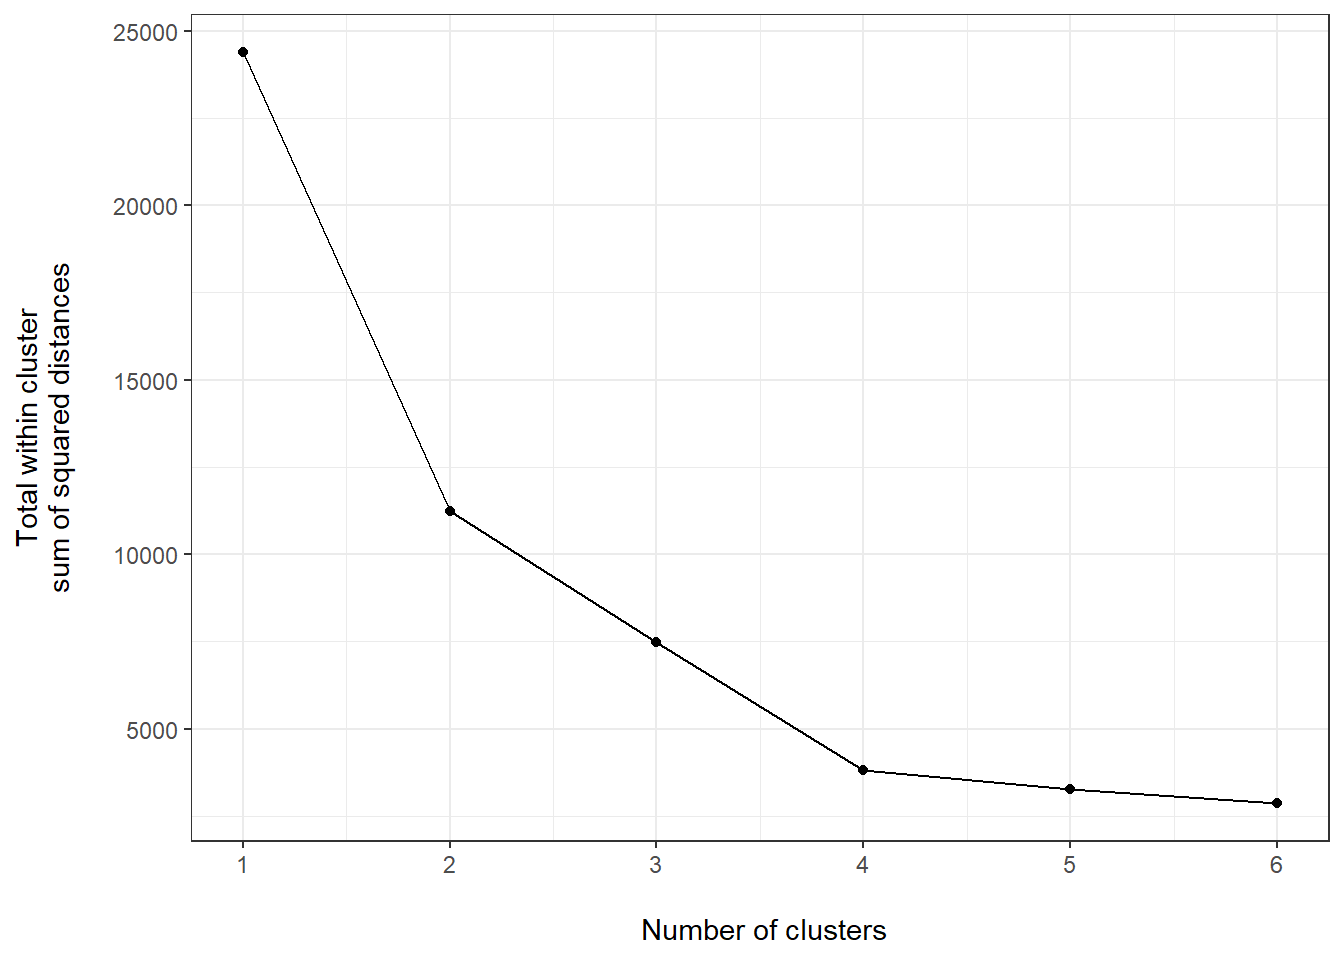
These scores are also useful in defining a group of looked after children with the most complex needs. Again it is not clear how this cut off should be defined so this analysis again uses a data led approach - K means clustering.
This approach iteratively clusters together observations through aiming to minimise each observation’s euclidean distance from its nearest cluster centre. The number of clusters is varied until the most appropriate solution is found. One method of determining this most appropriate solution is a scree plot of the total squared residual distance from observations to their assigned cluster centre. This will always decrease with an increasing number of clusters, however examining the point beyond which improvements become minimal provides a numeric indication of the most appropriate number of clusters.
Figure 34 below demonstrates that there is little improvement in fit beyond 4 clusters.
Figure 34: Fit of 1 to 6 clusters
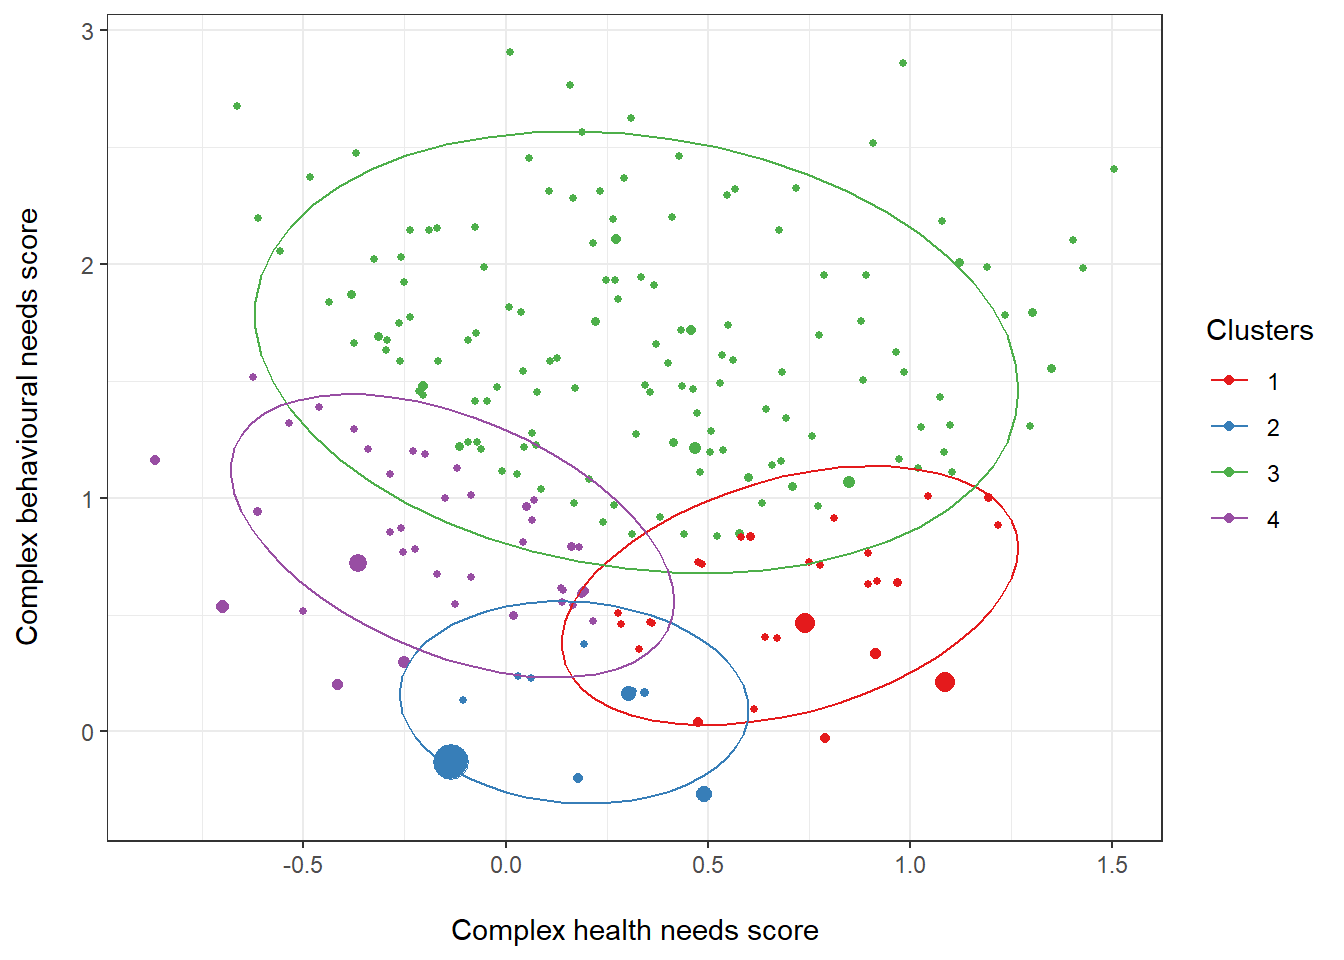
Examining the average behavioural and health needs scores for these 4 clusters (Figure 35) demonstrates that there is one group (cluster 3) with the highest behavioural needs scores and comparatively high complex health needs. This cluster is used as the highest complexity group in this report.
Figure 35: Clustering of behavioural and health needs scores - note size represents number of observations at each point
Data was provided by all local authorities except: Newham, Bury, Sunderland, Bath and North East Somerset, East Riding of Yorkshire, Bournemouth, Swindon, Reading, Wokingham, Medway, Lancashire↩
An HCPC is a numeric identifier assigned to all qualified social workers in England. Note: this will not be available for social workers registered outside of England or workers who are not fully qualified social workers (for example some family support workers).↩
Ofsted ratings taken from Ofsted children’s social care data in England 2018↩
Source for foster placement supply is Fostering in England 1 April 2017 to 31 March 2018↩
School places supply statistics calculated from School capacity: academic year 2017 to 2018. School Ofsted ratings taken from State-funded school inspections and outcomes: management information - Inspection judgement used is where inspection date is closest to start of 2017/18 financial year or the child’s first school entry date if not in school at start of 2017/18.↩
Calculated as 2017/18 local authority budget divided by the number of children in care in an LA at the 31st March 2018. Source for budgetary information is published section 251 data↩
Social worker stability
This year we received data submissions from 140 local authorities1, providing some form of information on social worker histories for 92% of children in care at the 31st March 2018 (after data cleaning; see below). To minimise burden on local authorities, the collection was kept very similar to the previous year. Where possible, social worker histories (consisting of one row per episode with a social worker per child) were provided for the cohort of children in care at the 31st March 2018 spanning the previous 2 years. Note: this can therefore include periods where the child can have been out of care but still assigned a social worker.
The only change made to the collection this year was to specify that HCPC codes should be provided as pseudonymised identifiers for social workers2. This was to investigate the potential for linking this return to the Children’s Social Work Workforce Census in the future. This is useful in expanding the matching potential of the data, however this means spells where a HCPC number could not be found for a worker will be under counted. This means totals below are likely lower estimates of children’s social worker changes. Where HCPC codes could not be found, other identifiers provided in the data were used in place. For context, 98% of episodes had meaningful identifiers entered for a social worker, and 88% of these had codes recognisable as a HCPC number (either SW followed by a number of digits or a 5-6 digit numeric code).
As with last year, we also asked for information on whether a social worker change was due to a change in team or not. This is to separate out changes in social worker that are due to moves across the structure of an LA’s social work teams from those that are due to other reasons (for example a social worker leaving). This information was provided by 138 out of the 140 local authorities submitting data.
Data cleaning
As with last year we excluded:
Matched sample profile
After this cleaning and matching to the CLA census, this gave a final sample size of 69,200 children in care at the 31st March 2018 with information on their social worker histories. Table 3 below demonstrates that the profile of this matched sample is very similar to the profile of the full CLA census population.
Table 3: Profile of matched social worker sample
Child characteristic
Category
All CLA (n)
Matched SW sample (n)
Age at 31st March 2018
0-4
19 (14,080)
18 (12,780)
12-15
28 (21,430)
29 (19,760)
16+
23 (17,410)
23 (16,000)
5-11
30 (22,500)
30 (20,660)
Age at earliest period of care
0-4
38 (28,740)
38 (26,280)
12-15
18 (13,470)
18 (12,330)
16+
5 (3,880)
5 (3,560)
5-11
39 (29,330)
39 (27,030)
Gender
Female
44 (33,100)
44 (30,280)
Male
56 (42,320)
56 (38,920)
In care in both 2017/18 + 2016/17
No
30 (22,830)
30 (20,880)
Yes
70 (52,590)
70 (48,320)
In care throughout 2017/18
No
31 (23,060)
30 (21,090)
Yes
69 (52,360)
70 (48,110)
Type of 1st legal status in 2018
Criminal Justice legal status
<1% (320)
<1% (300)
Emergency protection order
1 (490)
1 (460)
Full care order
48 (36,070)
48 (33,300)
Interim care order
20 (15,000)
20 (13,640)
Other
<1% (<5)
<1% (<5)
Placement order
3 (2,410)
3 (2,180)
Police protection
3 (1,950)
3 (1,760)
S20
25 (19,170)
25 (17,560)
Type of first placement in 2018
Fostered not with relatives
65 (49,380)
66 (45,510)
Fostered with relatives
13 (9,680)
13 (8,920)
Hospital
1 (970)
1 (890)
Independent Living
2 (1,770)
2 (1,570)
Other
<1% (360)
<1% (340)
Other institution
1 (1,030)
1 (840)
Placed for adoption
<1% (290)
<1% (260)
Placed with parents
6 (4,250)
5 (3,710)
Residential
10 (7,690)
10 (7,160)